Bitcoin Cash [BCH/USD] Technical Analysis: The Grizzly-show is yet to end
![Bitcoin Cash [BCH/USD] Technical Analysis: The Grizzly-show is yet to end](https://coinhub.news/img/33/334f118329125e5945c71955787716ac_730_522.webp)
Bitcoin Cash has been mutilated by the hard fork that took place on November 15. However, exchanges like Coinbase have already accepted the ABC implementation as the winner and assigned it the ticker of Bitcoin Cash.
The current price of Bitcoin Cash is at $222.4 and the market cap is hovering around $3.87 billion. The 24-hour trade volume as seen on Coinmarketcap at the time of writing is $63.34 million, of which 23.39% of the total trade volume is contributed by Binance with trade pairs BCH/USDT and BCH/BTC.
1 Hour
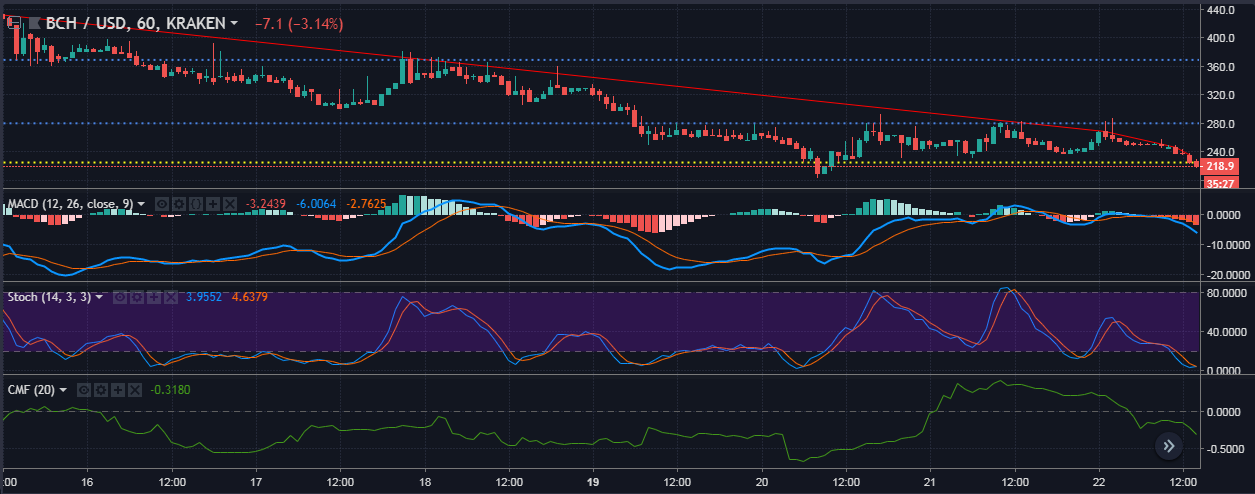
Bitcoin Cash has suffered due to the hard fork and has no uptrend as a result. The downtrend for Bitcoin Cash extends from $431.7 to $235.5. The prices have dipped recently on November 20 and broke previous supports and the prices are currently being supported at $225.1. The resistance for Bitcoin Cash has been set at $280 and $368.8.
The MACD line has crossed the signal line to the bottom in a bearish crossover. The histogram for MACD has red bars hanging from the zero line.
The Stochastic lines have struck the oversold zone in a bearish crossover.
The Chaikin Money Flow indicates that money flowing out of the market is more than the money flowing into the market as the CMF line has crossed below the zero line.
1 Day
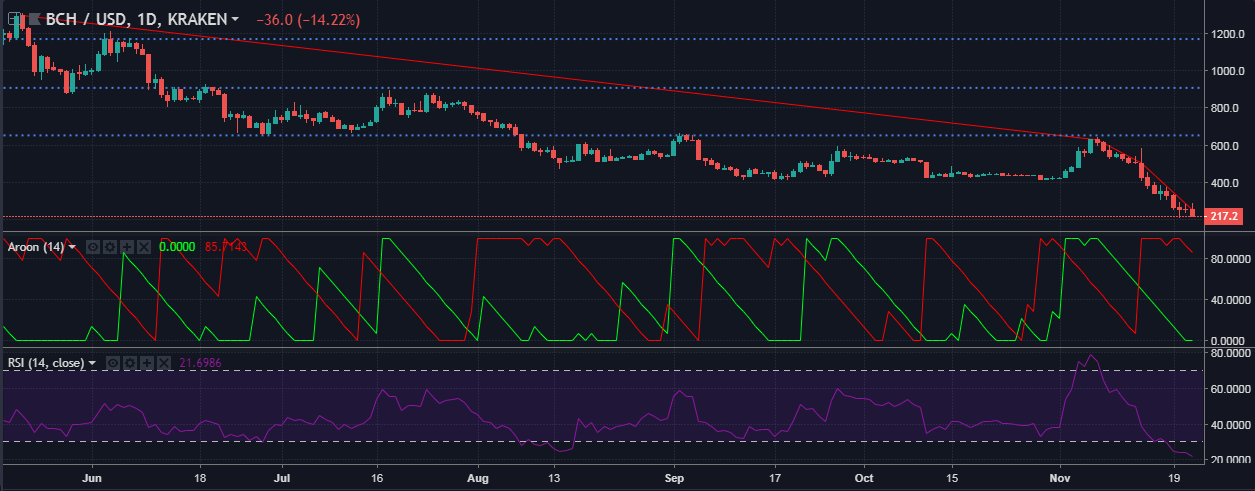
The downtrend ranges from $1295.6 to $253.2 while there doesn’t seem to be an uptrend in the bearish scenario. The resistance is set up at $651.8, $907 and $1169.2.
The Aroon indicator shows a downtrend in progression as the Aroon downline has hit the 100 line. The Aroon downline has struck the bottom, indicating that the uptrend has been extinguished.
The Relative Strenght Index shows an oversold market as it has breached the 30 line.
Conclusion
The one-hour chart shows an overall bearish trend as indicated by CMF, MACD and Stochasatic . The indicators in the one-day show a bearish trend that has overtaken the crypto-verse.


Article comments