Bitcoin Cash [BCH/USD] Technical Analysis: The cryptocurrency is yearning for a bull run
![Bitcoin Cash [BCH/USD] Technical Analysis: The cryptocurrency is yearning for a bull run](https://coinhub.news/img/1a/1a76cbf7741395d0236e0aeec6d07f2b_730_522.webp)
The rise and fall of the cryptocurrency market seem to be persistent even during the final week of 2018. The beginning of the week witnessed almost all the cryptocurrencies shooting up tremendously with double digit gains. However, disappointment bestrewed the crypto community once again when the values of digital assets dropped 2 days back. It is being noticed that all the major coins are suffering a decline rate of up to 10% in the past 24 hours.
Bitcoin Cash [BCH], which outperformed all the cryptocurrencies last week with a massive 150% hike is currently struggling to overcome the bearish hit. At the time of writing, BCH is trading at $153.24 with a market cap of $2.7 billion. The weekly statistics of the market depicts that BCH has dropped by 17.18%. Also, the cryptocurrency is currenlty the biggest loser in the 24 hour chart with a 10% loss.
1-hour:
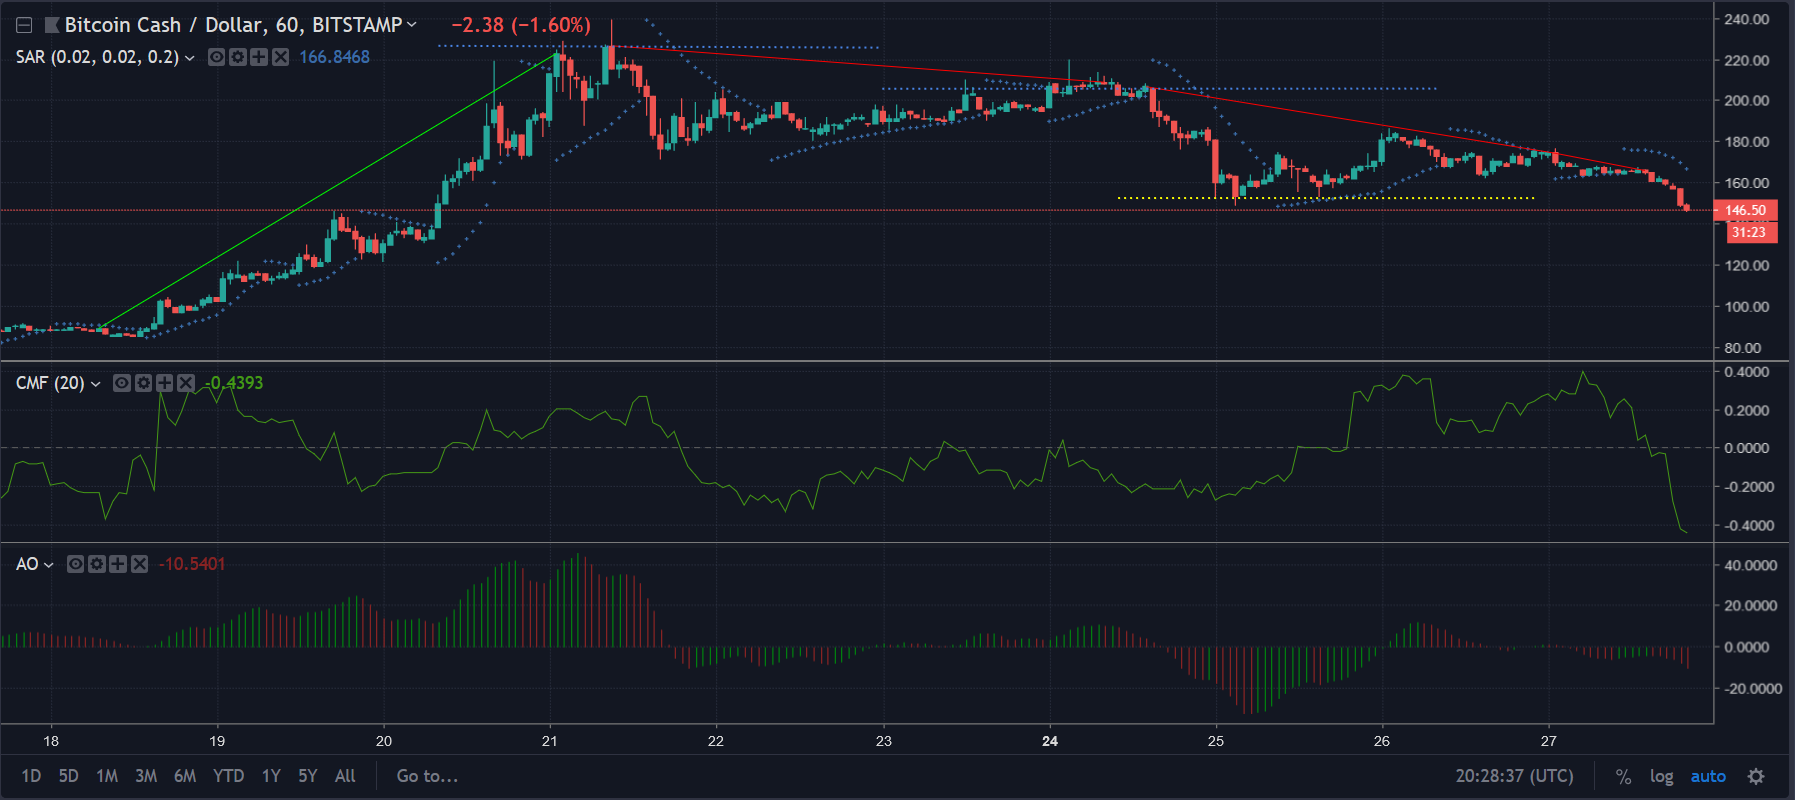
The hourly chart of BCH shows an uptrend extending from $88.3 – $222.7, which is followed by a continuous downtrend ranging between $225.2 – $209.4 and $208.19 – $164.99. A resistance point is fixed at $226.4 and the support point set at $152.8 has been broken and the price contiues to dip in this timeline.
The Parabolic SAR is currently forming the dotted indicators above the candlesticks indicating a bearish sign for the cryptocurrency.
The Chaikin Money Flow [CMF] has falled steep down the zero line demonstrating that the inflow of money has severely depeleted in case of BCH.
The Awesome Oscillator is continuousy forming negative bars below the zero line on the histogram, which shows a clear support for the other indicators mentioned above.
24 hours:
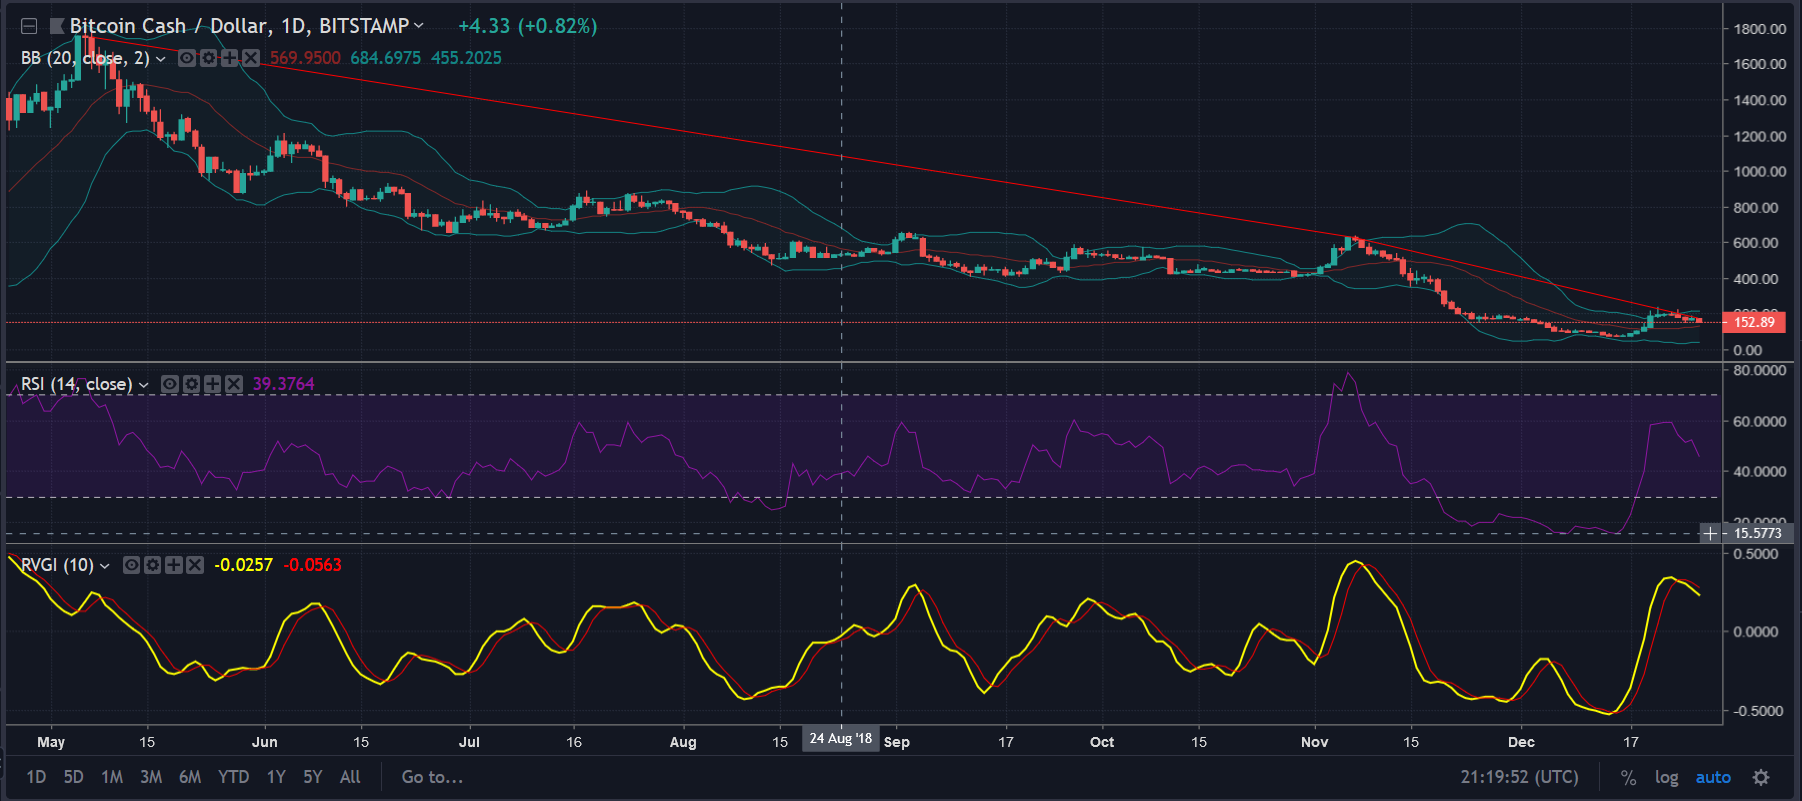
In the daily chart of Bitcoin Cash, we can see a massive downtrend ranging between $1729.3 – $594.69 – $167.4.
The Bollinger Bands has shown a clearly bearish market since November, as the candlesticks are alligned below the moving average [MA] line. Though BCH gained its momentum in the past few weeks, the price has started to move along with the MA. The upper band and the lower band of the indicator shows a narrow path indicating a less volatile market.
The Relative Strength Index [RSI] had risen steadily from the overbought zone to stay within the RSI range, however, it is gradually moving back to the overbought zone in this timeframe.
The Relative Vigor Index [RVGI] has taken a bearih crossover with both the reading line and signal line moving downwards.
Conclusion:
All the indicators used in this technical analysis is evidently favoring a bear market in both the timeframes. The short term indicators are showing strong support for bears in the 1 hour chart.


Article comments