Bitcoin Cash [BCH/USD] Technical Analysis: The bear crashes the bull-fight
![Bitcoin Cash [BCH/USD] Technical Analysis: The bear crashes the bull-fight](https://coinhub.news/img/66/66fd906ecad95801294191453c5c3f36_730_522.webp)
The cryptocurrency market is still recovering from the bear-assault that occurred this week. Bitcoin Cash [BCH] is also amongst the most injured coins from the collapse, wherein it slumped by over 12% yesterday. Other coins to have undergone the consequence were Ethereum [ETH] and XRP that also took a hit of over 10%.
At press time, BCH is trading at $450.31 with a market cap of $7.83 billion. The coin is delighted to be in the green zone, currently up by 0.12% with a 24-hour trading volume of $346.5 million. Over the last 24 hours, BCH started off with a bullish approach, took a deep hit and bounced back to the green zone today.
1 hour:
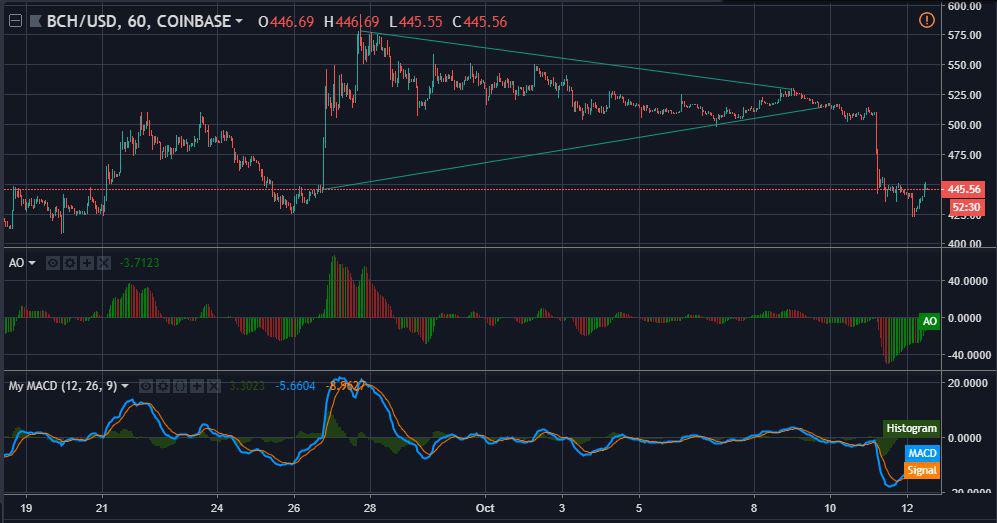
The 1-hour candles of Bitcoin Cash have received a signal of a trend breakout ahead. The trend line from $444.58 to $514.19 is acting as a support while the line ranging from $578.77 to $529.48 is maintaining the resistance level in the current scenario.
The Awesome Oscillator is following into the bullish footsteps, flashing a green light at the BCH market.
More so, the MACD is completely in tune with the Awesome Oscillator. It made a bullish crossover through the signal and is going for the BCH win.
1 day:
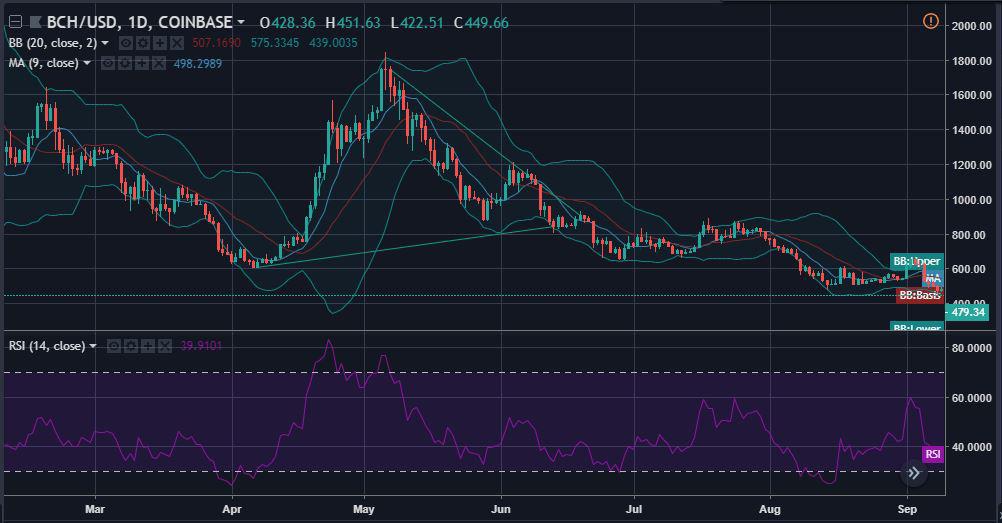
In the 1-day timeframe of BCH candlesticks, the Bollinger Bands has been flashing towards medium-volatility but is currently widening its bottleneck, suggesting a hint of aggressiveness in the price volatility of BCH.
The moving average [MA] is appearing to be bearish on the BCH market, with its head approaching a downward trend.
Meanwhile, the Parabolic SAR is running alongside a similar conclusion mde by the MA. The dots are pushing the candlesticks downward, imposing a dip in the market.
Conclusion:
The technical analysis is ruling in favor of a short-term bullish but a longe-term bearish market for the BCH community, as the indicators applied in the 1-hour candlesticks are projecting bullish results while the 1-day analysis is arguing a bearish turn of events.


Article comments