Bitcoin Cash [BCH/USD] Technical Analysis: Bull run imminent after prices bottom
![Bitcoin Cash [BCH/USD] Technical Analysis: Bull run imminent after prices bottom](https://coinhub.news/img/be/be2cd8c80b0a144d19153b2997e9025e_730_522.webp)
Bitcoin Cash [BCH] might finally be seeing a light at the end of the tunnel as the prices in the long-term trend have hit the support and starting to slowly bounce back while coins like Bitcoin [BTC], Ethereum [ETH] and XRP are still stuck in the sideways trend.
The fourth-largest cryptocurrency in the world, BCH has been on the downtrend since May and has finally bottomed at $434.41.
1-hour:
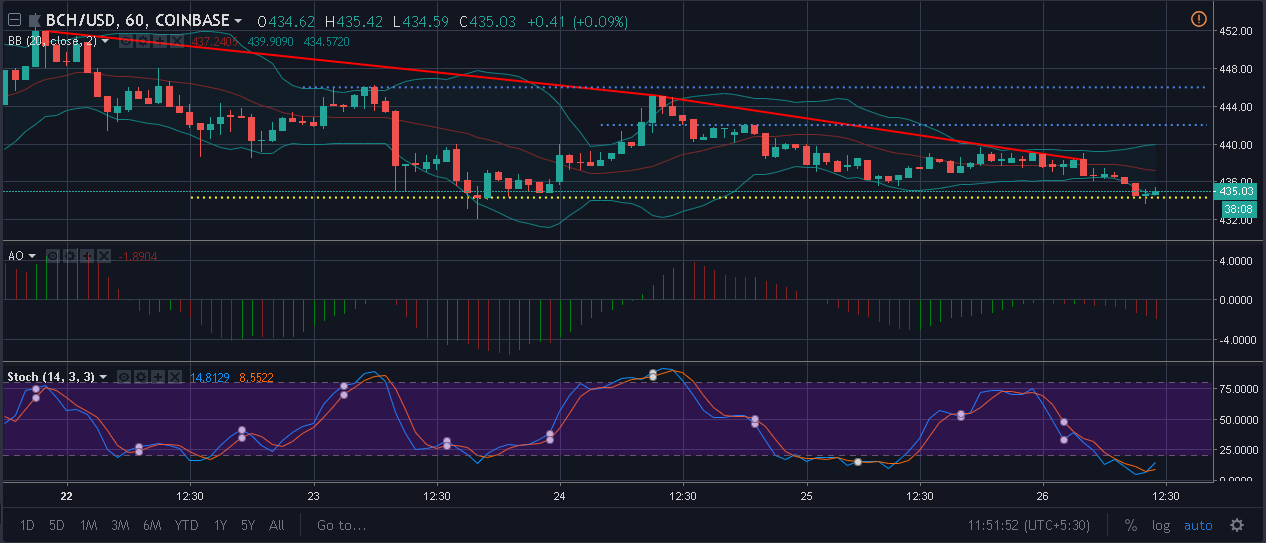
The candles are below the moving average in the Bollinger bands indicating a bearish move. The bands, however, have started to expand and move away from each other indicating the increase in volatility in the market.
The Awesome Oscillator shows a collection of increasing red spikes, indicating a shift in the momentum of the market towards the sell-side.
The Stochastic Indicator clearly shows the saturation of the sell-side. The crossover has happened towards the upside, indicating a bullish move.
1-day:

The Parabolic SAR markers are well-above the candle, with a noticeable gap indicating a huge bear pressure in the market.
The MACD histogram shows red spikes indicating a persistent selling momentum and the MACD line is close to the signal line and might cross over soon.
The RSI has seen its share of ups and downs and has fallen to the lower band, indicating a dominance of the selling pressure.
Conclusion
In the 1-hour chart, as indicated by the Bollinger bands, the market volatility is getting high. The Awesome Indicator indicates an increase in selling momentum, while the Stochastic clearly shows the saturation of sell pressure and the take over by the bulls.
In the long term, one-day chart, the parabolic and RSI indicator shows a bearish pressure in the market, while the MACD line might cross over the signal line, indicating a bull run.


Article comments