Bitcoin [BTC/USD] Technical Analysis: Bulls to take over in the larger time frame
![Bitcoin [BTC/USD] Technical Analysis: Bulls to take over in the larger time frame](https://coinhub.news/img/48/48af70fb497353644f6d39cf4f599828_730_522.webp)
Bitcoin [BTC] has been ranging above and below the $4,000 line for a few weeks now, after breaking a major support line at $6,500. The current market cap of Bitcoin is holding at $69.83 billion while the trading volume is at $5.17 billion. The 24-hour change in the price shows a decline of 3.51% for Bitcoin.
1-hour
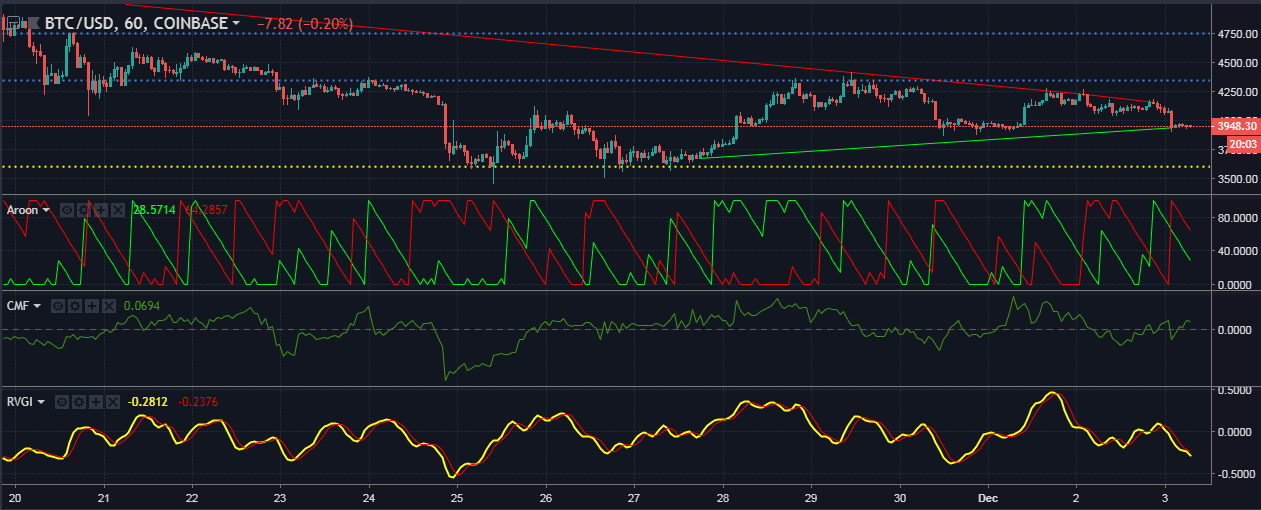
Bitcoin, in the one-hour chart, shows an uptrend that ranges from $3,676 to $3,940, while the downtrend ranges from $5,110 to $4,160. The prices have bounced off the support at $3,605 twice, but it is still holding strong. The resistance points of Bitcoin in the one-hour chart span from $4,345 to $4,750.
The Aroon indicator shows a faster rate of decline of the uptrend as compared to the downtrend. The downtrend, while still stronger than the uptrend, is still reaching an exhaustion.
The Chaikin Money Flow indicator is hanging just above the zero-line, which indicates that the buyers are in a tough fight with the sellers and are winning, even though it’s by a small amount.
The Relative Vigor Index shows a bearish divergence in the market as the prices are correlated directly with the RVGI indicator.
1-day
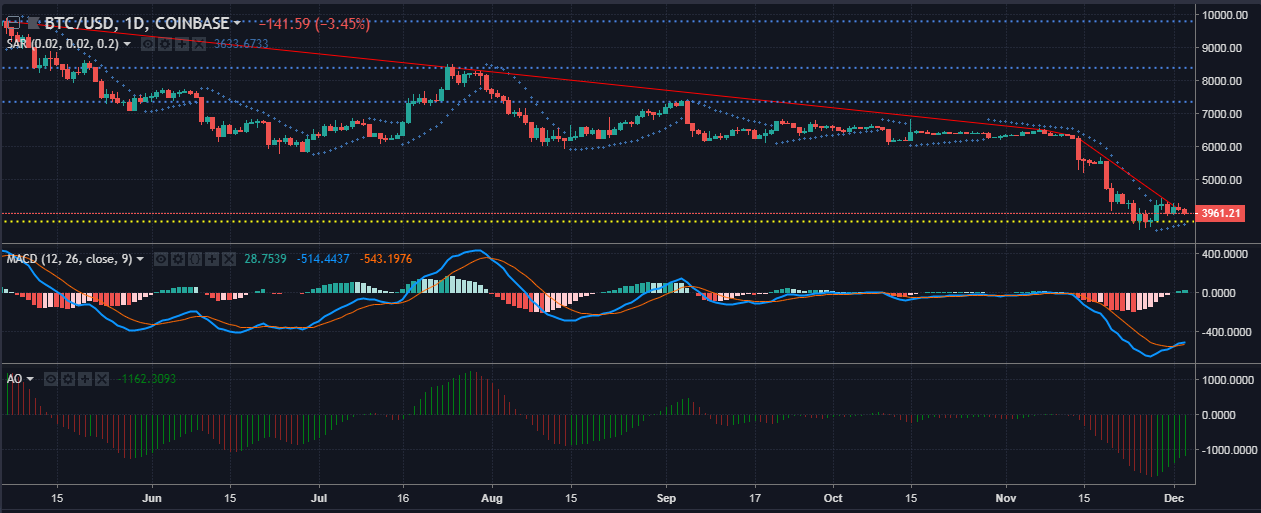
The downtrend for Bitcoin extends from $9,900 to $4,105, with no uptrend in sight as the prices are dipping between the $3,900 to $4,200 range. Bitcoin prices are finding support at the $3,730 point, which was tested on November 25. The resistance points are seen ranging from $7,360, $8,390, and $9,800.
The Parabolic SAR markers are formed below the price candles, indicating a bullish support pushing the Bitcoin prices higher.
The MACD indicator shows a bullish crossover after dipping deep down. The histogram also shows signs of recovery as the green bars are spawning above the zero line.
The Awesome Oscillator shows a transition into green bars which indicates an increase in prices, but not enough for a rise in momentum or a bullish crossover.
Conclusion
The one-our chart shows a bearish outlook for Bitcoin’s prices. The one-day chart for Bitcoin looks surprisingly bullish as indicated by the Parabolic SAR, MACD and Awesome Oscillator.


Article comments