Bitcoin [BTC] Technical Analysis: Bull leads the coin towards the top of the mountain
![Bitcoin [BTC] Technical Analysis: Bull leads the coin towards the top of the mountain](https://coinhub.news/img/b0/b002427fac4fc18372f8cac9cb402e4d_730_522.webp)
The new year has been merciful to many major cryptocurrencies as they registered growth, making the market green. The world’s largest cryptocurrency, Bitcoin [BTC], at the time of press, rose by 3.14% over the past 24 hours.
The coin was valued at $3,881.89 with a market cap of $67.7 billion. The coin registered a 24-hour trade volume of $4.8 billion with a hike of over 2% over the past seven days. The coin is still climbing up the hill with 0.82% over the last hour.
1-hour
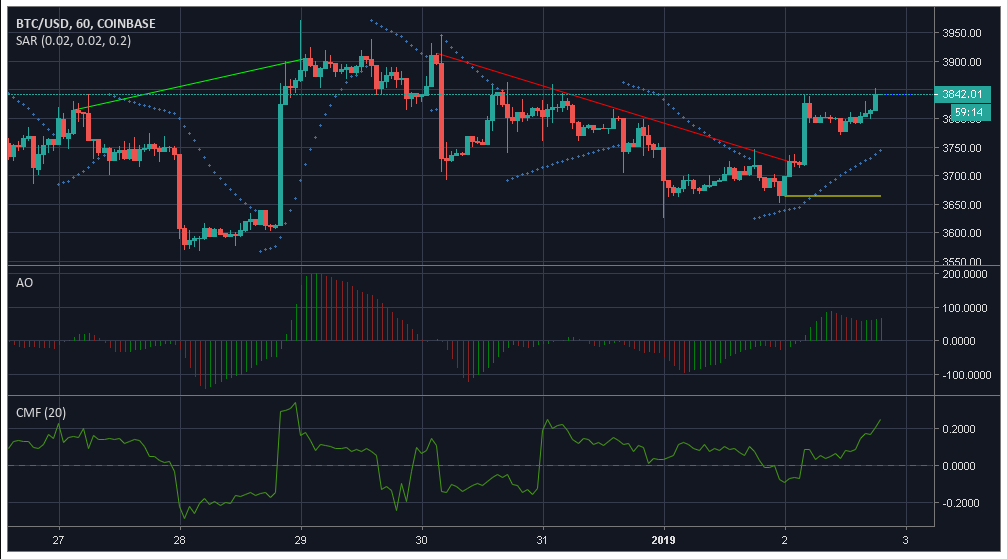
As per the one-hour chart of BTC, the coin observed an uptrend from $3814.61 to $3904.83, followed by a downtrend from $3914.04 to $3724.04. The coin is offered support at $3664.31, with immediate resistance at $3841.90.
Parabolic SAR hints towards a bullish market as the markers align under the candlesticks.
Awesome Oscillator indicates a bullish market gaining momentum.
Chaikin Money Flow points above zero, marking a bullish market.
1-day
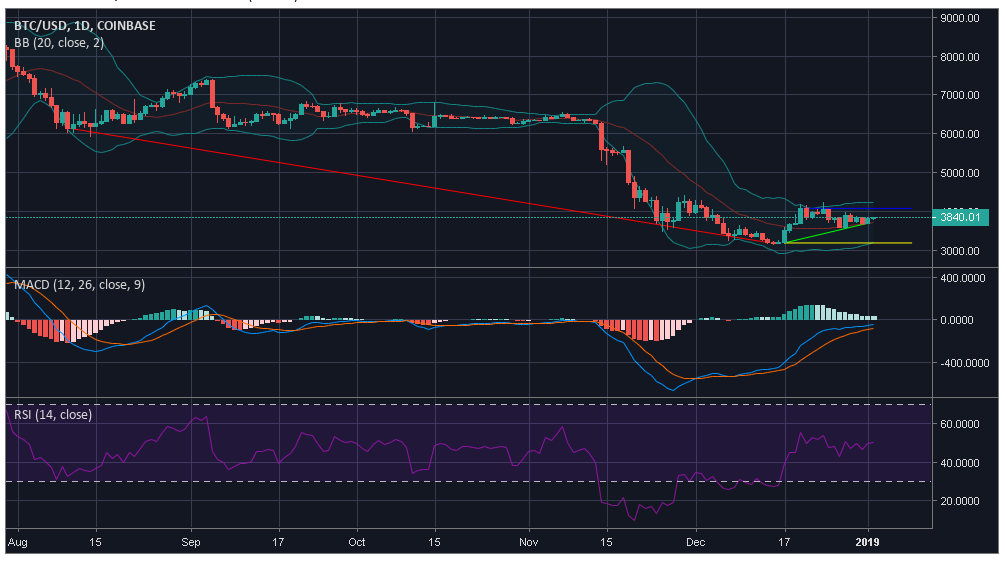
The one-day chart of the coin points towards a massive fall from $6146.01 to $3195.71. A minuscule uptrend was noticed from $3184.28 to $3691.87, with a resistance marked at $4075.34. BTC was offered support at $3184.28.
Bollinger Bands appears to be at a diverging point, indicating increased volatility in the market. The moving average line is under the candlesticks, thus marking a bullish market.
MACD line is above the signal line hinting towards a bullish market.
Relative Strength Index indicates that the buying and selling pressures are evening each other out.
Conclusion
According to the indicators, Awesome Oscillator, Parabolic SAR, Chaikin Money Flow, MACD line and, Bollinger Bands, a bullish market is predicted.


Article comments