Ethereum Price Analysis Nov.28: ETH Rebounds 20%. Will It Hold?

The market had finally started its upward correction, with Bitcoin price running up by 15% from the $3600 support, Ethereum is up by 21% from the $98 bottom to $118 as of now.
This correction was anticipated after the massive declines since BTC broke down the descending triangle formation in the daily chart, precisely two weeks ago.
Since the start of this bearish sentiment, every correction has been pretty flat, and now, for the first time, we see the bulls fighting to gain some momentum.
At the moment, it’s too early to determine whether this bounce is a beginning of a change in the trend’s direction, or just a temporary correction before diving even deeper towards the $3000 price.
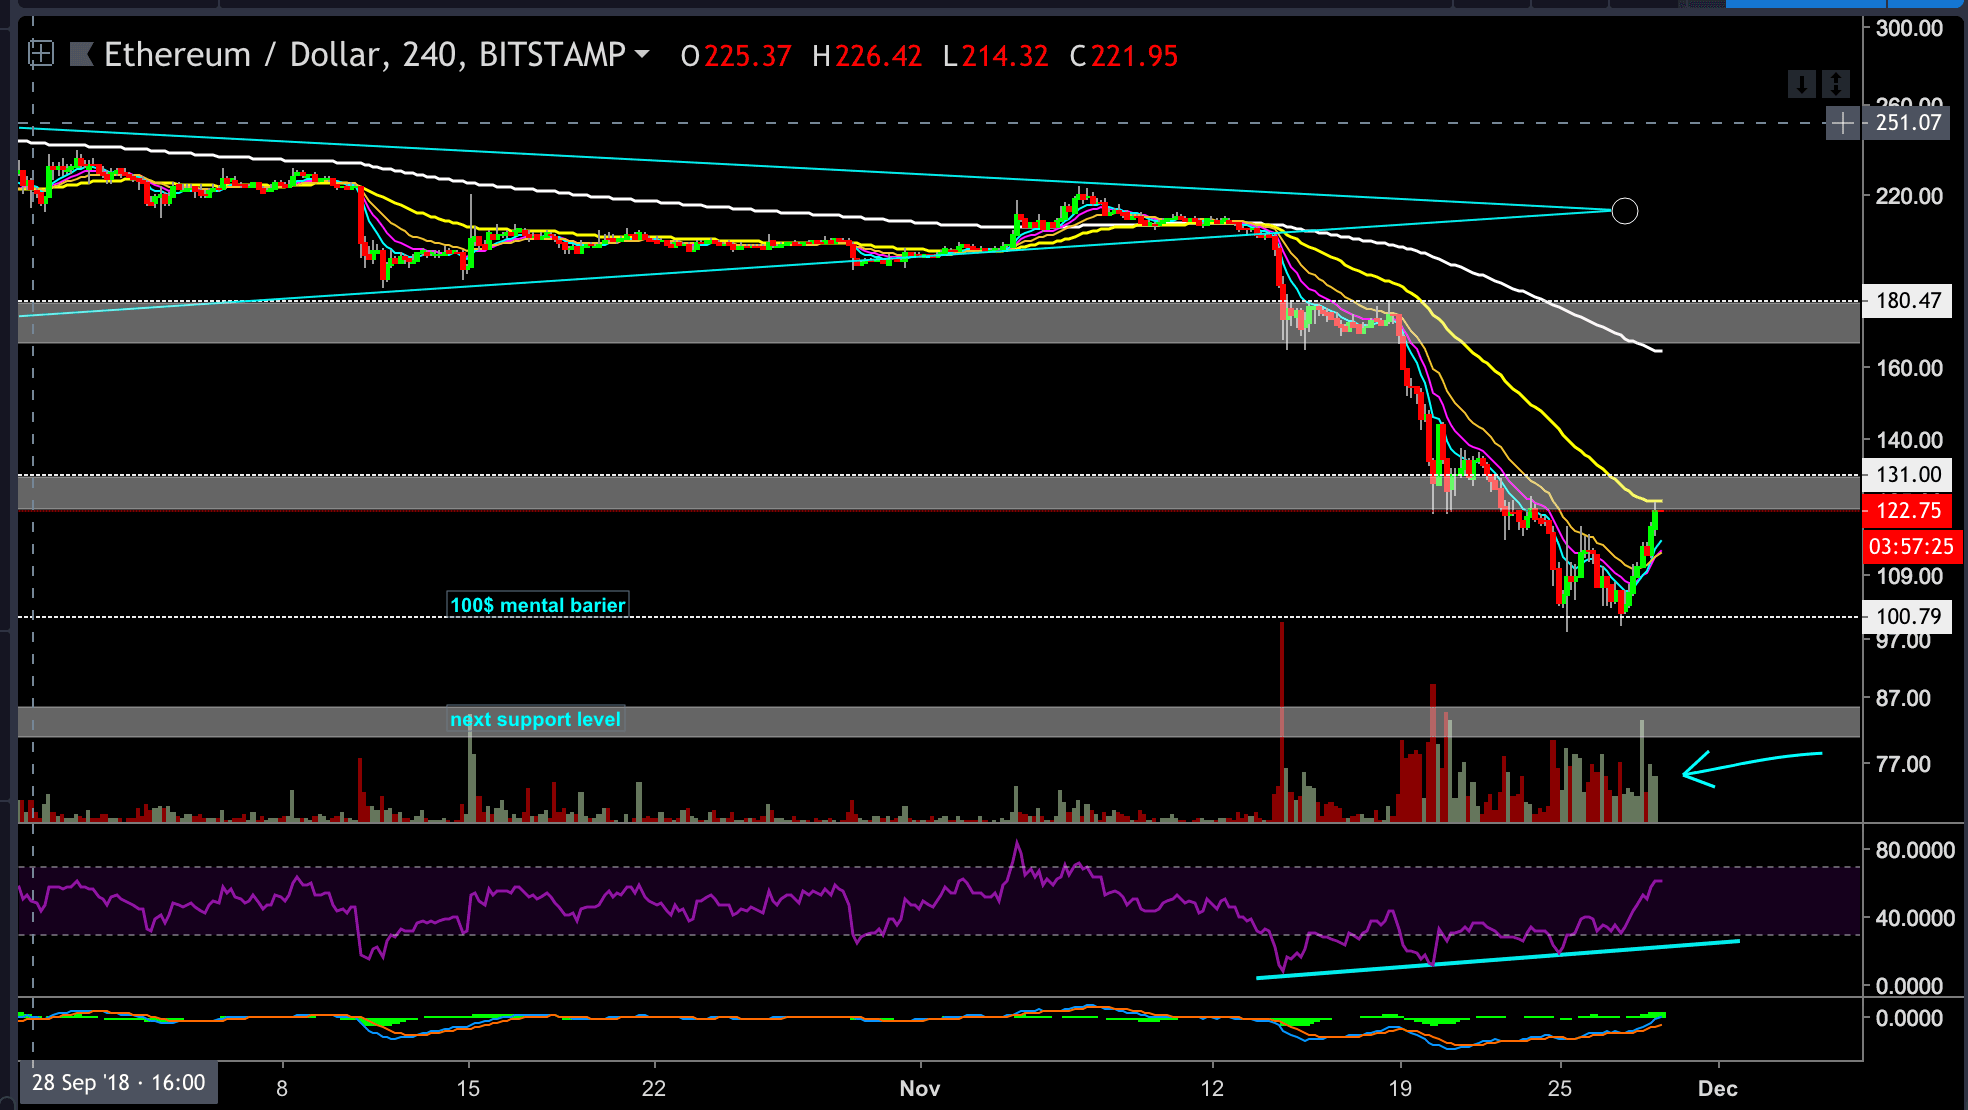
Looking at the 4 hours chart
At the time of writing, Ethereum is being traded around the $120 price level and is attempting to break above the $120 – $124 support-turned resistance level.
Notice how the round number $100 has acted as a healthy support level and was held well against the bears’ efforts. It is a mentally strong number and a logically right spot for bulls to leave their buy-limit orders around. As mentioned in our previous analysis, the bounce after reaching the $100 was expected.
ETH Forecast
If the bulls keep up their excellent work and ETH breaks above the $120 – $124 resistance level, then The 55EMA might be the next target – at $128 price level or even higher: at the $135 – $137, where lies the next resistance level from the daily chart.
On the other hand, if the resistance level holds, and the bears try to regain power, then ETH will probably get down to retest the $100 area.
ETH/USD BitStamp 4-Hours Chart
Cryptocurrency charts by TradingView. Technical analysis tools by Coinigy.


Article comments