Upward Momentum is Strong Says This Week’s Crypto Technical Analysis

As expected, BTC continued rising and already reached its first target, with other cryptos mimicking its move cautiously.
The heavy BTC rise is probably because of indices being near their highs, and because investing in traditional assets is currently somewhat risky.
Cryptos, meanwhile, have been near their lows, the risks being much lower, too.
The market looks ready to continue the upmove, but one has to wait for BTC and other cryptos to break out the key levels before a real rally begins.
Bitcoin
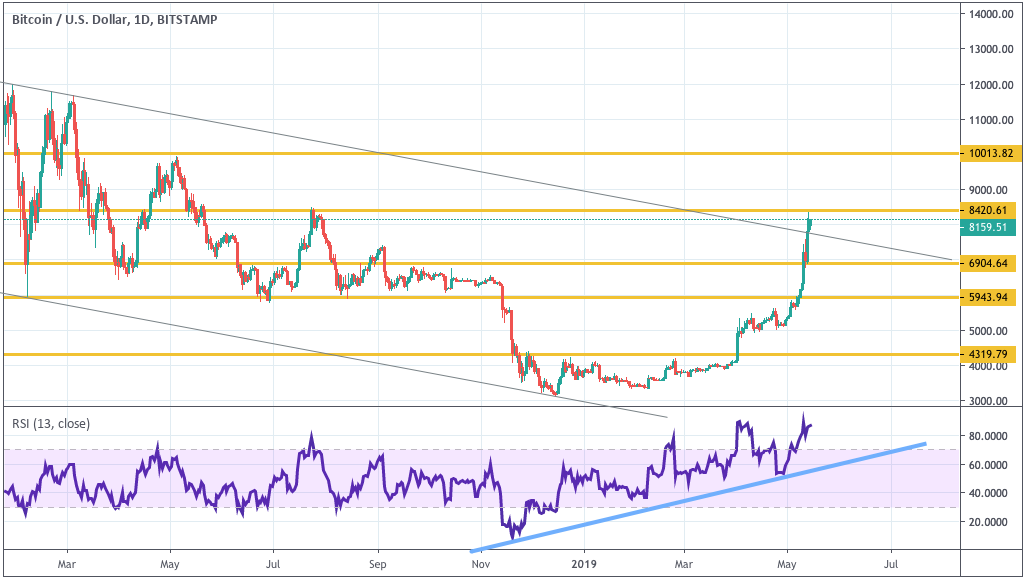
BTC tested $8,500, and once it gets broken out, the crypto may continue rising to $10,000.
The flagship crypto also broke out the upper descending channel boundary, which may now get tested, and then the rise is likely to continue, especially if the price bounces off the support.
The indicator is still above 80, which means the upward momentum is strong. Conversely, BTC may also fall down heavily and close below $6,900, in which case the correction will take the crypto down to $5,900.
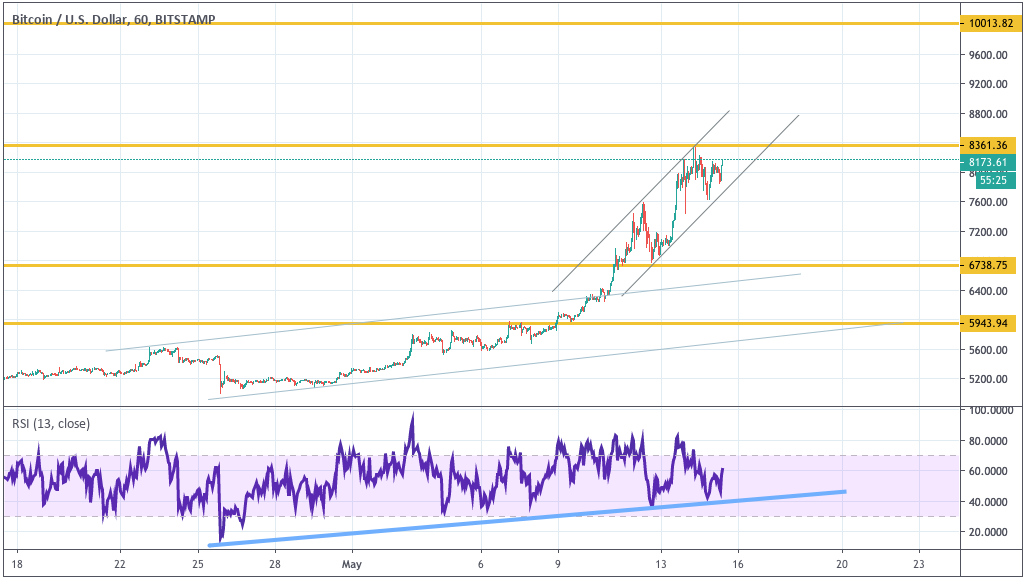
On H1, BTC is moving along an ascending channel, still failing to stay above the resistance. The lower channel boundary may get tested, and the price may head up again. eval(ez_write_tag([[336,280],'trustnodes_com-medrectangle-4','ezslot_1',169,'0']));
RSI has already bounced off the ascending trend line a few times, which confirms the possible rise. Conversely, Bitcoin may hit the lower boundary and close below $7,550, which may then take the price to $6,740.
EOS
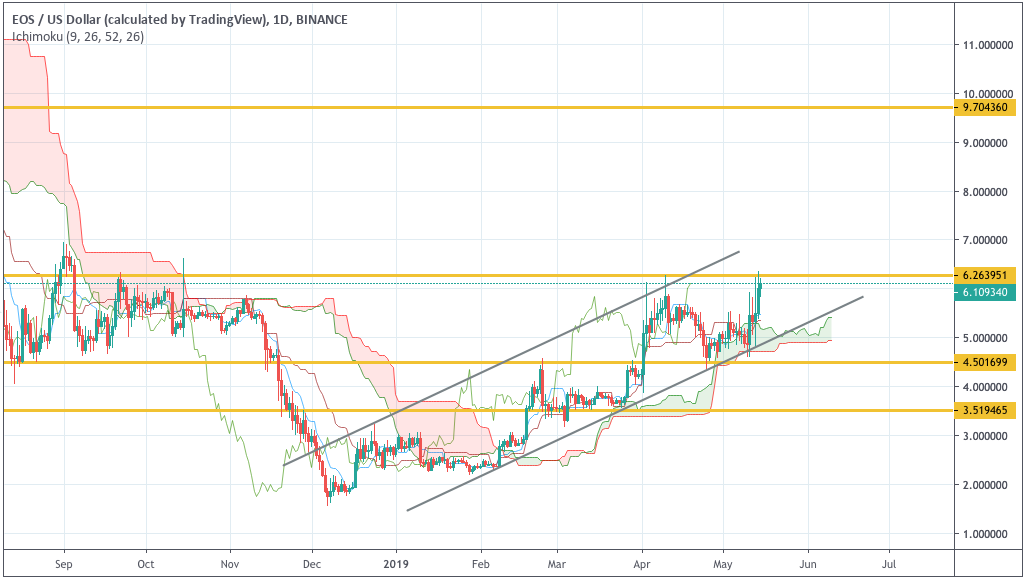
EOS bounced off the upper Ichimoku boundary, which signals a rise, with another signal given by the signal lines crossover.
Still, the price is meanwhile testing the resistance, and may reach $9.70 once it gets above $6.35.
Then, a slight correction may occur, with EOS testing the upper Ichimoku cloud boundary. Conversely, EOS may also fall down to hit the support and close below $4.50, and then reach $3.50.
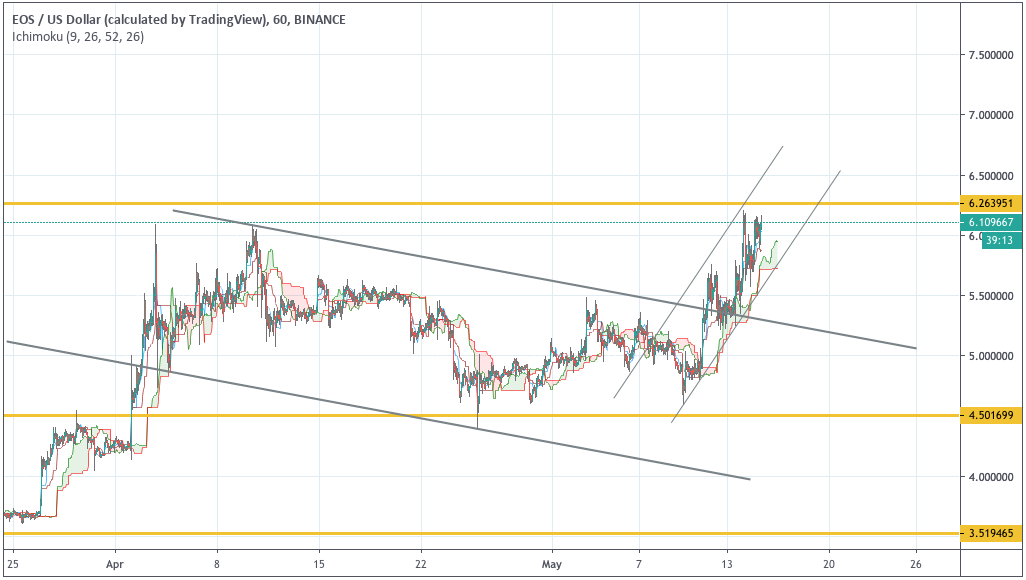
eval(ez_write_tag([[336,280],'trustnodes_com-box-4','ezslot_2',171,'0']));On H1, the price was able to leave the descending channel and is heading currently up. The lower boundary may get tested soon, after which the price is likely to continue rising.
Conversely, it may also fall in case it closes below $5,50, which may send EOS below $4.50 afterwards. Meanwhile, in case the resistance at $6.25 gets broken down, an uptrend will take its place.
Ethereum

Ether is rising quite heavily, like other cryptos. The price broke out the upper Bollinger band and is now trading above the upper ascending channel boundary.
This means ETH is ready to rise further, covering the distance equal to the channel width.
A correction to the broken out channel boundary may follow, and then the price is likely to rise to $285.
Conversely, ETH may also fall down to hit the support and close below $185, in which case the fall will then take the crypto down to $145.
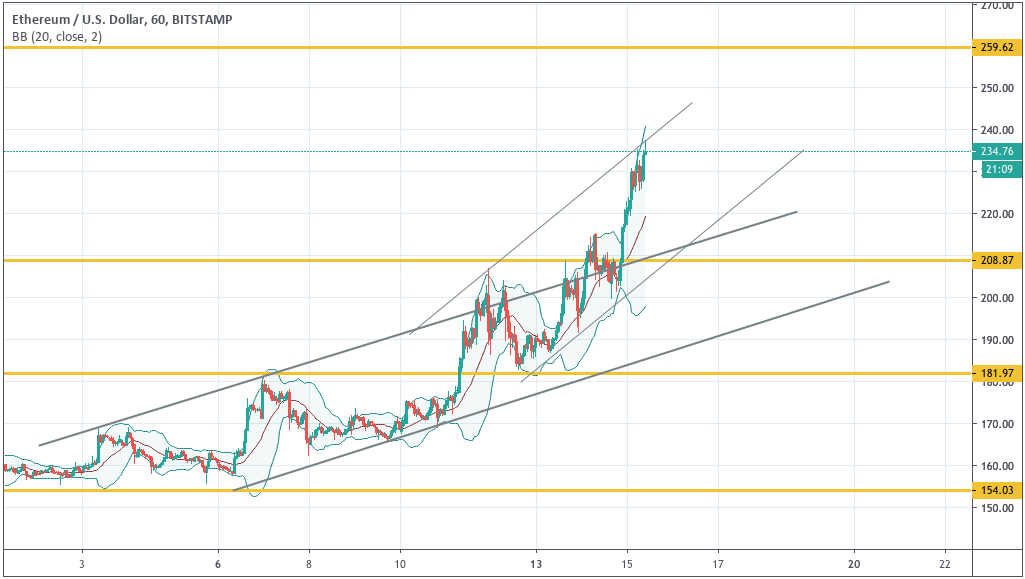
On H1, ETH is rising faster and may soon test the middle Bollinger band, then reaching $250 or $260 in the short term.
Once the crypto is above $250, this will signal ETH is ready to rise further. Conversely, if the lower band gets broken out and the price stays below $205, Ether may continue falling, staying around $180.
Litecoin
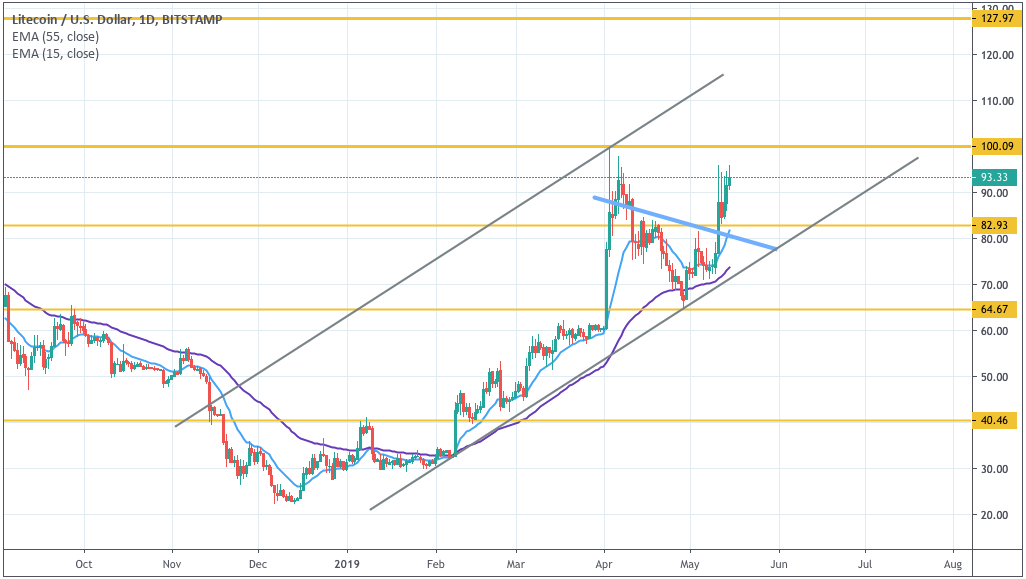
LTC is forming an inverted head and shoulders pattern, while the EMA’s are still signaling a rise.
The price bounced off the EMA area quite strongly, which means the momentum is high, and LTC is likely to hit $100 soon. eval(ez_write_tag([[300,250],'trustnodes_com-large-leaderboard-2','ezslot_3',177,'0']));
On D1, the crypto may test $85, but only to continue rising further.
Litecoin may, however, hit $80 and stay below as well, which will mean the price will leave the current channel and continue its downside correction.

On H4, LTC is likely to hit the round number of $100, especially in case the RSI support gets tested.
In the short term, the lower channel boundary may get tested, too, and then the price is likely to continue rising. Conversely, if the price falls below $80, it may then hit $65.
XRP
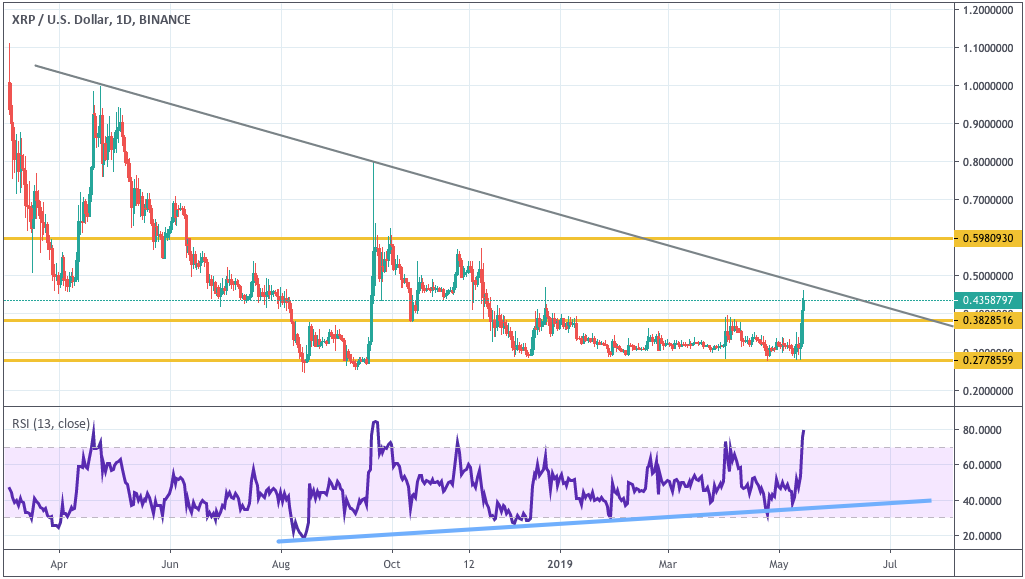
XRP had been testing the support for long, and then finally bounced off it. The RSI has been bouncing off the trend line since early 2019.
The support around $0.3825 may soon get tested, with the price rising to $0.5980, especially if the descending trend line gets hit and the price stays above $0.5000.
Conversely, XRP may also break out the support and close below $0.3820, with the cryto heading further down.
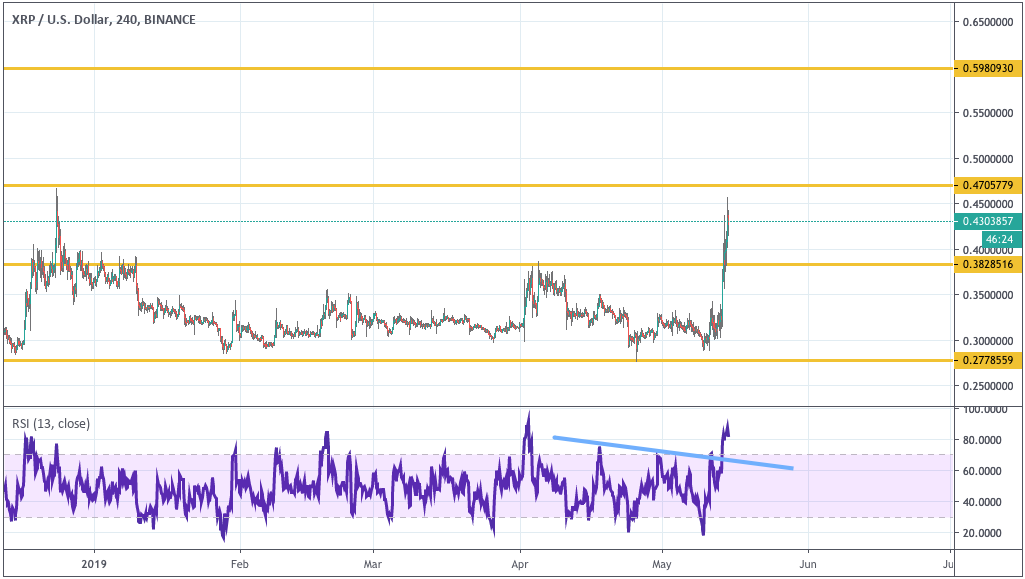
On H4, the price is also outside the range it has been trading within before, and XRP is ready to continue its rise.
Once the resistance gets broken out and the price stays above $0.4755, it may then rise to $0.5980, especially in case the RSI bounces off the trend line.
Conversely, if XRP breaks out $0.3820, the crypto may get back to the previous range.
The weekly Crypto Technical Analysis is provided by Dmitriy Gurkovskiy, Chief Analyst at RoboForex.
Needless to say, all statements and views expressed above and any forecasts contained herein are solely based on the author’s particular opinion.
This analysis may not be treated as trading advice. RoboForex and Trustnodes bears no responsibility for trading results based on trading recommendations and reviews contained herein.
Copyrights Trustnodes.com


Article comments