Top 5 cryptocurrencies to watch this week: BTC, LINK, UNI, XTZ, ATOM
Bitcoin (BTC) price has yet to recapture the $40,000 level and traders who were expecting a quick resumption of the uptrend may have been caught off guard by the recent pullback. This could have led to the liquidation of about $500 million worth of cryptocurrency futures positions in the past 24 hours.
Over leveraged positions provide the necessary ammunition during the uptrend, but they become a liability when the trend reaches an inflection point.
When the markets turn down, leveraged long positions quickly turn into a loss, resulting in margin calls from brokers. When the margin requirements are not met, the brokers dump the positions at market price, leading to a sharp plunge.
Therefore, data indicating a reduction in leveraged Bitcoin positions in the past few days is a positive sign as it decreases the risk of cascading liquidati.
While a sharp fall is usually avoided when the markets are not overleveraged, sustained buying is needed to maintain the higher levels. If that does not happen, the price continues to correct gradually.
Grayscale Investments has been one of the major buyers in the past few months but they now have a new competitor, Osprey Funds, which began quoting in the over-the-counter market on Jan. 15 under the ticker symbol OBTC. The firm is offering a competitive management fee structure compared to Grayscale.
This is a positive sign for crypto markets because if both these firms attract institutional investors, the buying may resume and Bitcoin can reverse course to pursue new highs.
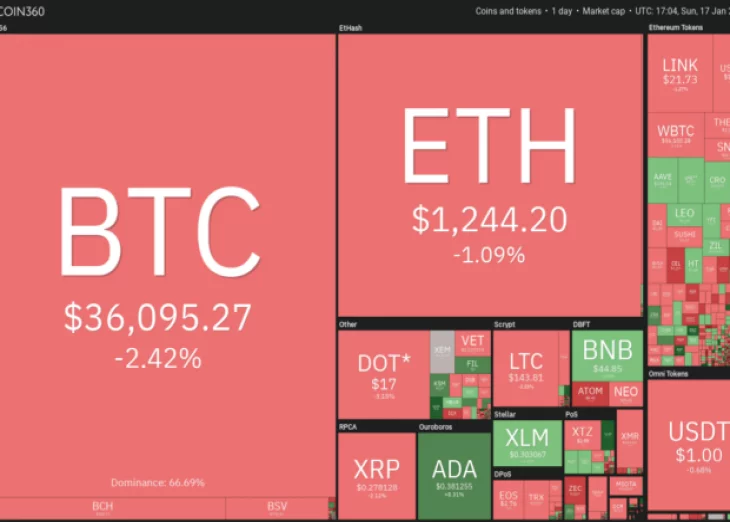
While Bitcoin remains stuck in a range, select altcoins are running hard. Let’s study the charts of the top-5 cryptocurrencies that may be favored by the bulls in the next few days.
Bitcoin is currently consolidating in an uptrend. The price action of the past few days has formed a symmetrical triangle, which generally acts as a continuation pattern. The long tail on today’s candlestick shows the bulls are buying the dips to the 20-day exponential moving average ($34,241).
The upsloping moving averages and the relative strength index (RSI) in the positive territory suggest that bulls are in control. If the buyers can push the price above the triangle, the next leg of the uptrend could begin.
The first stop could be the current all-time high at $41,959.63, but if the bulls can propel the price above it, the BTC/USD pair may rally towards the pattern target at $50,000.
Contrary to this assumption, if the rebound fails to find buyers at higher levels, the bears may try to sink the price below the triangle. If they succeed, the pair may drop to the 38.2% Fibonacci retracement level at $29,688.10.
This level may attract buyers but if the bulls fail to push the price above the 20-day EMA, then the correction could deepen to the 50-day simple moving average ($26,581).
The 4-hour chart shows that the bulls have purchased the drop to the support line of the symmetrical triangle but they may face resistance at the moving averages that are sloping down.
If the price turns down from the moving averages, the bears will try to sink the price below the triangle. If they succeed, a deeper correction is likely.
On the contrary, if the bulls can push the price above the moving averages, the pair may rise to the resistance line of the symmetrical triangle. A breakout of this resistance may start the uptrend.
However, if the price turns down from the resistance line of the triangle, the pair may trade inside the triangle for a few more days.
Chainlink (LINK) broke above the $20.1111 resistance on Jan. 15 and followed it up with another up-move on Jan. 16, hitting a new all-time high at $22.96. But the long wick on the Jan. 16 candlestick suggests profit-booking at higher levels.
The price rebounded off the $20.1111 breakout level today, suggesting that the bulls have flipped this level to support. If the bulls can now push the price above $23, the LINK/USD pair could rally to $27 and then to $30.
The upsloping 20-day EMA ($16.25) and the RSI near the overbought zone suggest bulls are in control.
Contrary to this assumption, if the price turns down and breaks below $20.1111, the next stop is likely to be $17.7777. This is an important support because a break below it will indicate a possible change in trend.
The 4-hour chart shows the breakout above $20.1111 had pushed the RSI deep into the overbought territory, which may have attracted profit-booking from short-term traders.
However, the positive sign is that the bulls aggressively purchased the dip to the 20-EMA. If the bulls can sustain the price above $21.5709, the pair may retest $22.96. A break above this resistance may resume the uptrend. The upsloping moving averages and the RSI in the positive zone suggest bulls have the upper hand.
This bullish view will invalidate if the bears sink and sustain the price below the 20-EMA. Such a move could pull the price down to $17.7777, indicating the momentum has weakened.
Uniswap (UNI) is currently in an uptrend but is facing selling above the $9 mark as seen from the long wick on Jan. 16 and today’s candlestick. If the bulls do not give up much ground, it will suggest traders are not rushing to the exit after the recent rally and are buying on dips.
The upsloping 20-day EMA ($6.15) and the RSI in the overbought territory suggest bulls have the upper hand. If the UNI/USD pair stays above the 38.2% Fibonacci retracement level at $7.4725, the bulls will try to resume the uptrend.
If they can push the price above $9.3776, the rally could extend to $12.4597 and then to $15.
Contrary to this assumption, if the bears sink the price below $7.4725, the pair may drop to the 20-day EMA. Usually, a deep correction suggests that the momentum has weakened and that may result in a few days of range-bound action.
The 4-hour chart shows the pair is currently consolidating after the recent sharp up-move. The bulls are buying the dip to the $8 support and the bears are selling above $9.
If the bulls can push the price above the $9 to $9.3776 overhead resistance, the uptrend could resume.
On the other hand, if the bears sink the price below the 20-EMA, the decline could extend to the 50-SMA. Such a move could keep the pair range-bound for a few days.
Tezos (XTZ) had been stuck inside the $2.85 to $1.85 range for the past few weeks. The bulls are currently attempting to push the price above the range and start a new uptrend.
However, the long wick on the Jan. 16 candlestick shows that the bulls are finding it difficult to sustain the price above the range. Today, the long wick and the tail on the candlestick indicates indecision among the bulls and the bears.
If the bulls can sustain the price above $2.85, the possibility of the start of a new uptrend increase. The upsloping 20-day EMA ($2.48) and the RSI above 66, suggest the path of least resistance is to the upside.
The first target objective on the upside is $3.90 and then $4.4936. This bullish view will negate if the XTZ/USD pair drops and breaks below the 20-day EMA.
The 4-hour chart shows the bulls had pushed the price above $2.85 but they could not build upon the strength, which led to a correction. However, the bulls aggressively purchased the dip to the 20-EMA and are now trying to drive the price above $3.1838. If they succeed, the uptrend could resume.
On the contrary, if the price turns down from the current levels or the overhead resistance and drops below the 20-EMA, it could correct to the 50-SMA. A break below this support could signal that the recent breakout above $2.85 was a bull trap.
Cosmos (ATOM) rose above the stiff resistance at $8.877 on Jan. 16 and made a new all-time high at $9.60. Whenever the price hits a new all-time high, it is a sign that bulls are in command.
However, the bears have not given up yet as they have pulled the price back below $8.877 and are attempting to trap the aggressive bulls. The bullish momentum could weaken if the bears sink the price below the 61.8% Fibonacci retracement level at $7.093.
Conversely, if the bulls can defend the zone between the 38.2% retracement at $8.05 and the 50% retracement at $7.572, it will suggest strong demand at lower levels.
If the price turns up from this support zone, the bulls will try to resume the uptrend. A break above $9.60 could push the ATOM/USD pair to $12.10 and then to $13.974.
Both moving averages are sloping up and the RSI is in positive territory, indicating that bulls have the advantage. The pair has bounced off the 20-EMA and the bulls will now try to push the price above the $8.877 overhead resistance.
If they succeed, the pair could rise to $9.60 and a break above it will signal resumption of the uptrend. Conversely, if the bears sink the price below the 20-EMA, it will suggest that the momentum has weakened and a drop to $7.50 and then to the 50-SMA is possible.
The views and opinions expressed here are solely those of the author and do not necessarily reflect the views of Cointelegraph. Every investment and trading move involves risk, you should conduct your own research when making a decision.


Article comments