Ethereum Price Analysis Dec.26: ETH Is Following Bitcoin’s Decline in an Interesting Spot
Let’s start with a quick look over Bitcoin: BTC is currently trading around the $3750 price level, which is precisely 50% decline from the last peak of $4400. It is a reasonable entry point for bulls looking for a long position, in case they believe that BTC is about to make a second run upward.
If BTC gets the demand needed for a bounce, then it will strengthen the probability of a possible inverse Head and Shoulders formation that is currently developing on the 4-hour chart. The mentioned possible bounce from this current support level could play out as the right shoulder of the pattern. BTC can decline even lower, and still, hold the option for this bullish formation. In case of a breakout, the technical target of this formation would be around $5500 – $5700.
ETH completes a nice run during the past week
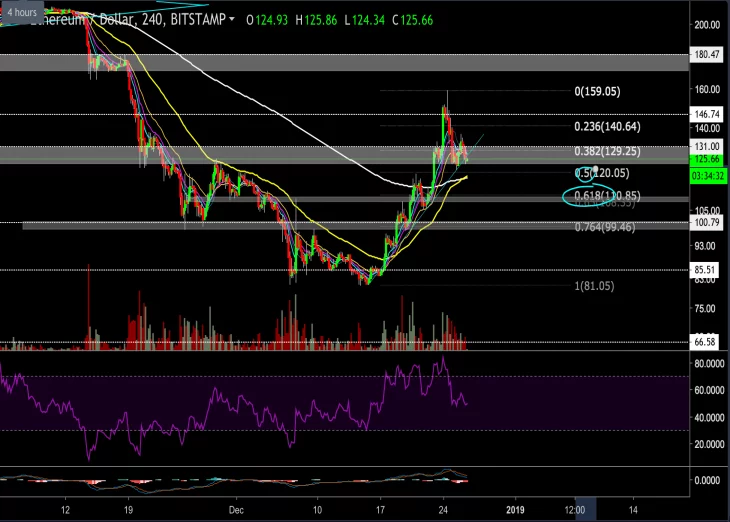
The highest candle closed exactly on our previous analysis target zone around the $145 price level, though the candle’s wick spiked to $158 for a short while. Over the past days, ETH had the highest gain among the major altcoins.
There is news regarding an upgrade in the Ethereum system, the miner’s block reward might be reduced, and it could positively affect the ETH value and support the strong move we noticed in the ETH chart.
Since the peak, ETH corrected almost 50% (from the last bullish move), as BTC did, and is currently trading above the $123 support level.
Looking at the ETH-USD chart
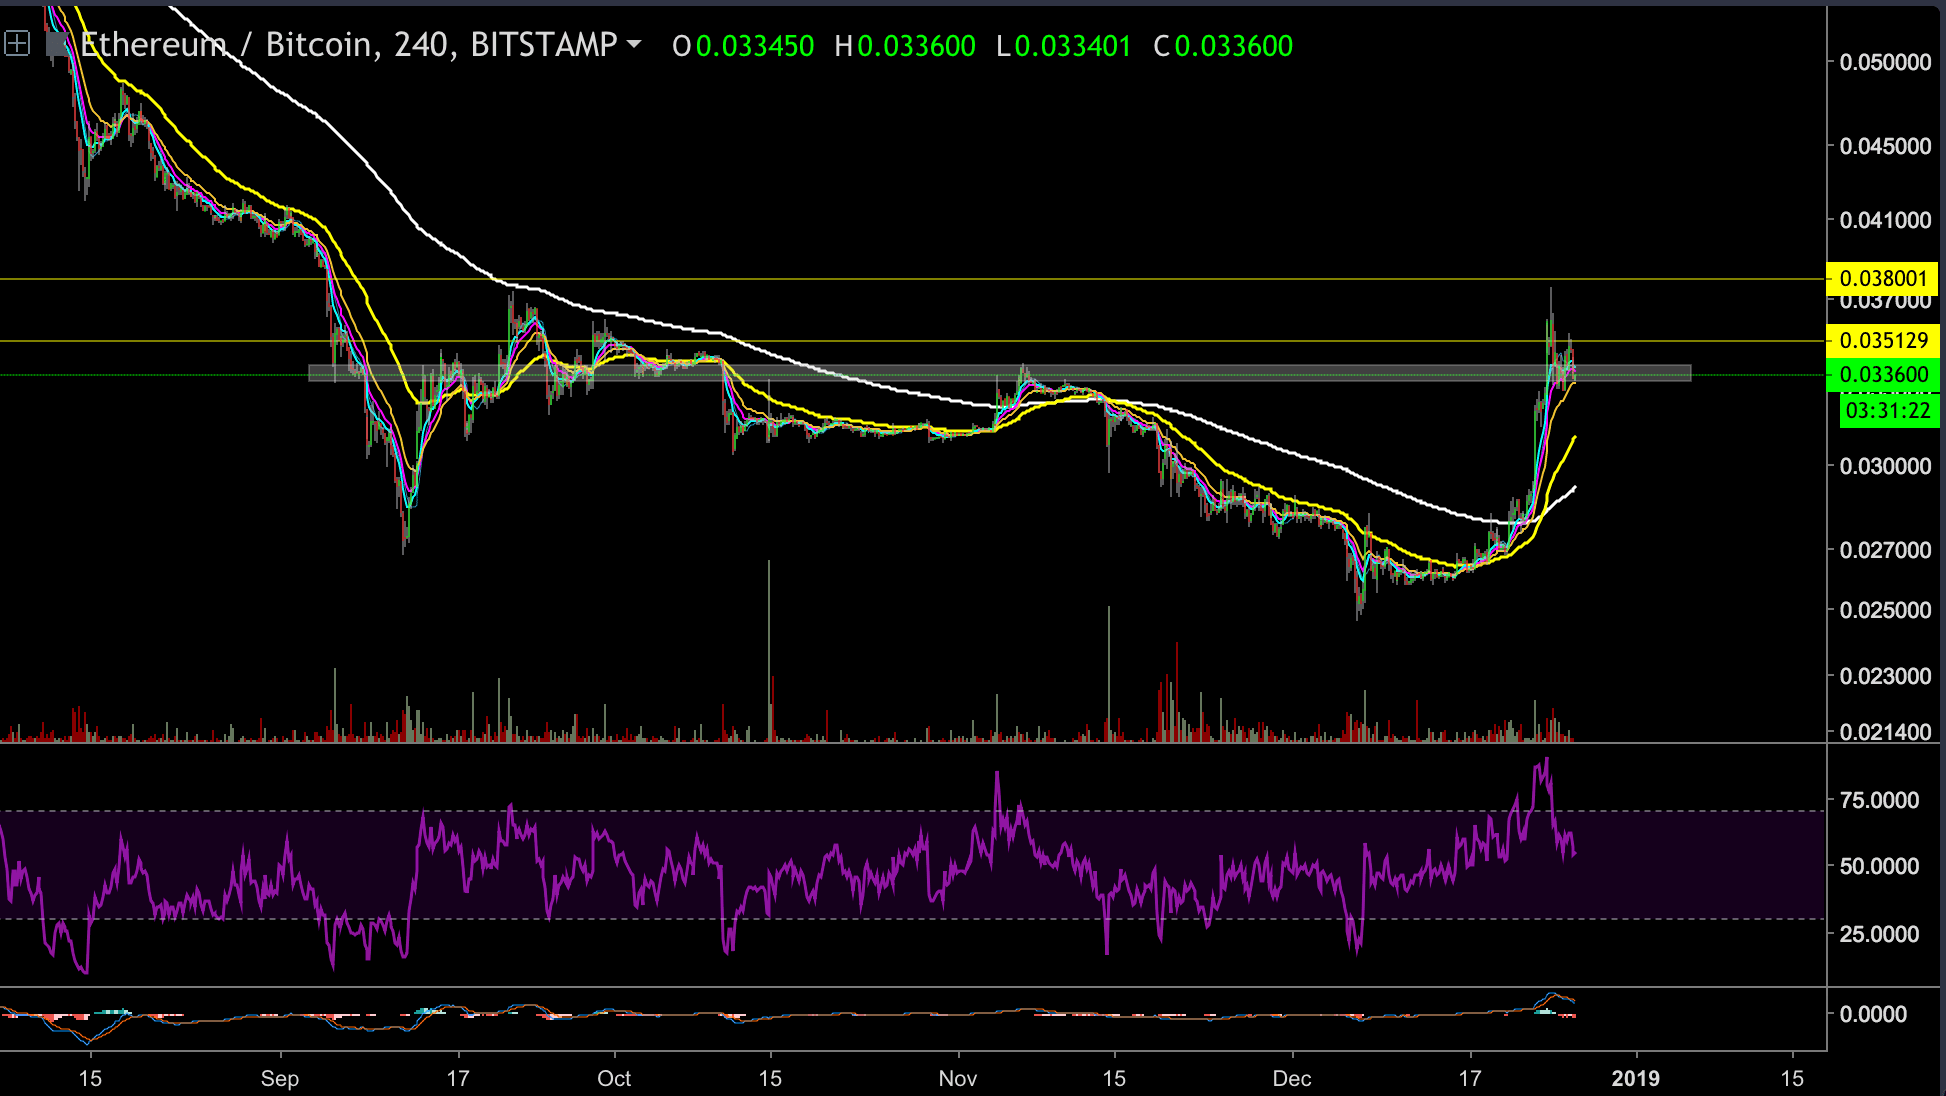
Looking at the ETH-BTC chart
ETH is currently trading around the 0.0333 – 0.034 BTC support level, after getting rejected by the 0.38 daily chart’s resistance level.
ETH/USD BitStamp 4-Hour Chart
ETH/BTC BitStamp 4-Hour Chart


Article comments