Fibonacci Retracements: Forecasting High-Probability Reversals in Cryptos

Fibonacci is the study of naturally occurring, proportional ratios. It can be found across disciplines: in biology, math, science, art, design, etc. It was first discovered by Italian mathematician Leonardo Fibonacci in the 12th century.
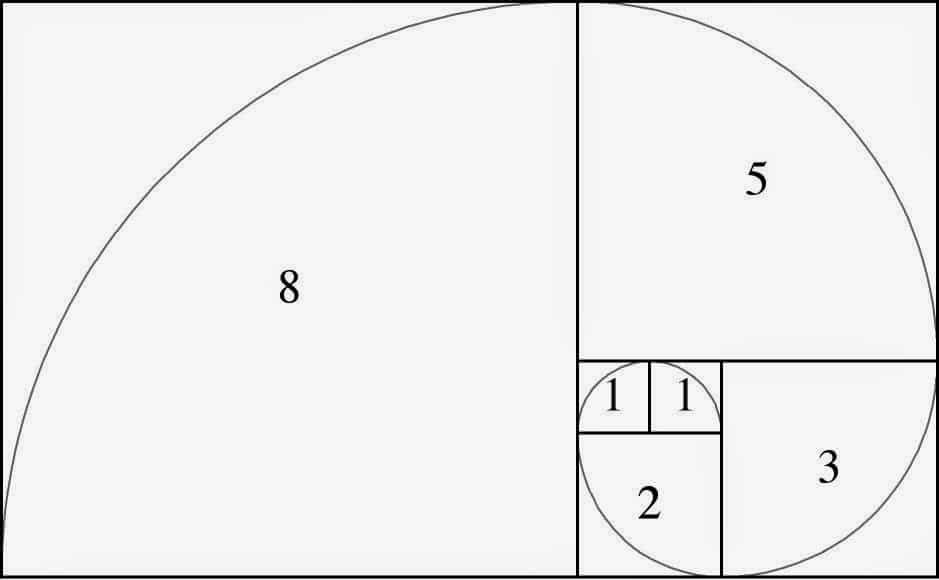
What Is Fibonacci?
The .618 ratio is also known as ‘The Golden Ratio’ given its widespread presence in the universe. For example, proportions of the human body feature several .618 to 1 ratios. For centuries, architects have designed aesthetically-pleasing buildings, using the Fibonacci ratio. Many decades ago, traders witnessed recurring .618 Fibonacci retracements among market swings. They also discovered several additional Fibonacci ratio relationships.
In other words, Fibonacci is a mathematical principle that exists just about everywhere. Even in trading.
Why Does It Work?
All crypto price action is rooted in waves of buying and selling pressure. These waves of price action are caused by mass greed and mass fear. All waves of buying/selling pressure eventually give way, and Fibonacci retracements have the ability to forecast the time/price zones of such exhaustion. The .618 ratio between significant, connected price swings often acts as an exhaustion/reversal zone.
Why Do I Need It?
Once you grasp basic Fibonacci retracement concepts, you will have a significant trading edge. You will know in advance where high probability support/resistance (S/R) price levels are. You will be able to trade with more confidence and less stress.
How can Fibonacci retracements help make me money in cryptos?
You’ll know in advance where the smart money is likely to enter/exit a crypto market. Then you’ll trade alongside them, never against them. This is the key to successful trading and investing.
Now, with that said, let’s get to the examples!
All crypto bull markets feature sharp corrections to the 50% or 62% Fib level. These swift pullbacks scare out weak traders and allow the smart money to add new positions at attractive prices. Then the market will rally, making new highs. This is how it played out in BTCUSD during July-September 2018:
Bitcoin rallied from 1830.00 to 4979.89 in seven weeks – a gain of 172%. But the decline into the 62% retracement at 2972.00 at point C only took 13 days. Think about that. Imagine how terrified those who bought in near point B were as prices began to plunge. You can bet that by the time the Fibonacci retracement low was hit at point C, most of those traders had already sold for a loss.
Then the big institutions stepped in, scooping up more Bitcoin at a bargain price. Institutional traders (hedge funds, banks, et al) know that the Fib 62% pullback is a low-risk entry point in a bull market. They patiently wait for corrections to that ratio and then they enter their long positions at that high-probability reversal zone. And you should too.
Key takeaways:
- All crypto bull markets feature sharp corrections to the Fib 62% retracement.
- Such corrections flush out weak (marginally capitalized) traders.
- Institutional traders patiently wait to add new positions at the Fib 62% level – because it works.
A downtrend is a series of lower swing highs and lower swing lows. Many times, the first Fib retracement after a major downdraft will only rally by 38.2%. Then the rally stalls and the downtrend continues. Here’s a look at this dynamic setup in BCHUSD:
This 12-hour chart of BCHUSD depicts a heavy downtrend (swing AB) that was followed by a weak relief rally up to the Fib 38% retracement. Long-term money flow (CMF (89)) remained negative for the entire downtrend/relief rally phase. That confirmed the bearish trend bias. At point C, BCHUSD stalled and then reversed sharply lower.
Short traders could have made nearly 24% on the stall/reversal short entry (swing CD). Most traders use oscillators (Double stochastic and RSI) to time short Fib level trade entries. And they’re especially aggressive with profit taking on short trades.
It takes time for fear to be washed out of a market after a major plunge. That’s why bear market rallies like that one typically fizzle out at the 38% Fib retracement. Traders were scared of more downside and they bailed out of rallies quickly.
Knowing this, you can plan to take advantage of future bear market pullbacks to the key Fib 38% retracement.
Key takeaways:
-
Strong downtrends are usually followed by weak relief rallies.
-
The Fib 38% retracement is a frequent stall/reversal point for such rallies.
-
If long-term money flows are bearish, shorting relief rallies is smart.
Sometimes two or more discrete Fib retracements will ‘agree’ on a common S/R price level. These S/R levels are extremely high probability stall/reversal areas. Pro crypto traders search out such levels and will enter/exit trades at/near those prices.
This two-day bar chart for BCHUSD revealed a potent resistance level at point C. That’s where the 38% retracement from swing AB coincided with the 62% retracement from swing 1B. BCHUSD rallied up to point C, stalled and then proceeded to decline by more than 1,000 points in only eight weeks.
The Relative Strength Index or RSI (14) histogram (bottom of chart) remained bearish (gray) for most of the downtrend in BCHUSD. At point C, it was still in bearish mode. That was a confirmation that going short near point C was a low-risk trading op. Oscillators like StochRSI and Double Stochastic can be used to time short and long entries.
You won’t make 60% gains on every trade using this Fib agreement tactic. But you will be amazed at how often it can produce winning trades.
Key takeaways:
- Fibonacci agreement levels are powerful, high-probability S/R stall/reversal zones
- The smart money will enter/exit their positions at/near such S/R zones
- Trade Fib agreement levels when long-term money flows are in your favor
The same Fib agreement technique also works well in oscillating markets. After swing AB, all price action was contained within that swing’s price range. Two attractive, long Fib agreement trade setups appeared.
In the first trade example, BTCEUR briefly dipped below the Fib 38/62% agreement line (calculated from swing AB and swing 1B) before rallying for eight days. A nice winner! In the second example, BTCEUR declined to the 62% and 100% Fib agreement level (again based on swings AB and 1B). After a minor spike below the agreement line (point E), BTCEUR staged a moderately strong, 3-day rally. Other key Fib agreement combos include the 24/50% and 50/79% retracements.
If you think that these are both cherry-picked examples, you’d be mistaken. These Fib agreement patterns occur in all crypto markets and in all time frames. As long as the crypto has good trading volume, this Fib tactic will work most of the time. That does not mean all Fib agreement trades will be big winners. Nor does it mean that the Fib levels are a magical barrier that guarantees a reversal. But they are incredibly consistent forecasting tools. Plot Fib levels on your charts and be amazed. Really.
You now know that all crypto bull markets experience sharp declines to the Fib 62% retracement. And that they will typically go on to make even higher highs. You know that strong bear markets feature weak Fib retracements that usually stall/reverse around the 38% level. And you now understand the power of Fib agreement levels, especially at the 38/62% combo.
Begin plotting various Fib retracements on the coins you trade today. Then you’ll have advance knowledge of high-probability S/R stall and reversal levels. And you’ll enter/exit your trades at the same critical Fib levels that pro crypto traders do. Even as amateur traders are trading in the other direction.
Disclaimer:
Speculation in the financial markets involves substantial risk and you should only use risk capital used when trading or investing. Always consult your licensed financial advisor before deploying risk capital in the financial markets.
The post Fibonacci Retracements: Forecasting High-Probability Reversals in Cryptos appeared first on CoinCentral.
source: https://coincentral.com/fibonacci-retracements-reversals-crypto/


Article comments