Bitcoin Price Analysis: After Sudden Upswing, Bitcoin Price Drifts Downward
This article originally appeared on Bitcoin Magazine.
Last week, we saw a violent move to the upside as bitcoin rallied 11% over the course of one day. Since peaking in the upper $3,600s, bitcoin has seen close to zero bullish follow-through, and the price has begun to drift downward over the course of the last week:

Figure 1: BTC-USD, Hourly Candles, Downward Drift
Downward-drifting markets like this can often be a sign that distribution is taking place. It represents an overall lack of bullish pressure. And, from the volume profile, we can see that selling pressure has remained constant throughout the week of downward drift:
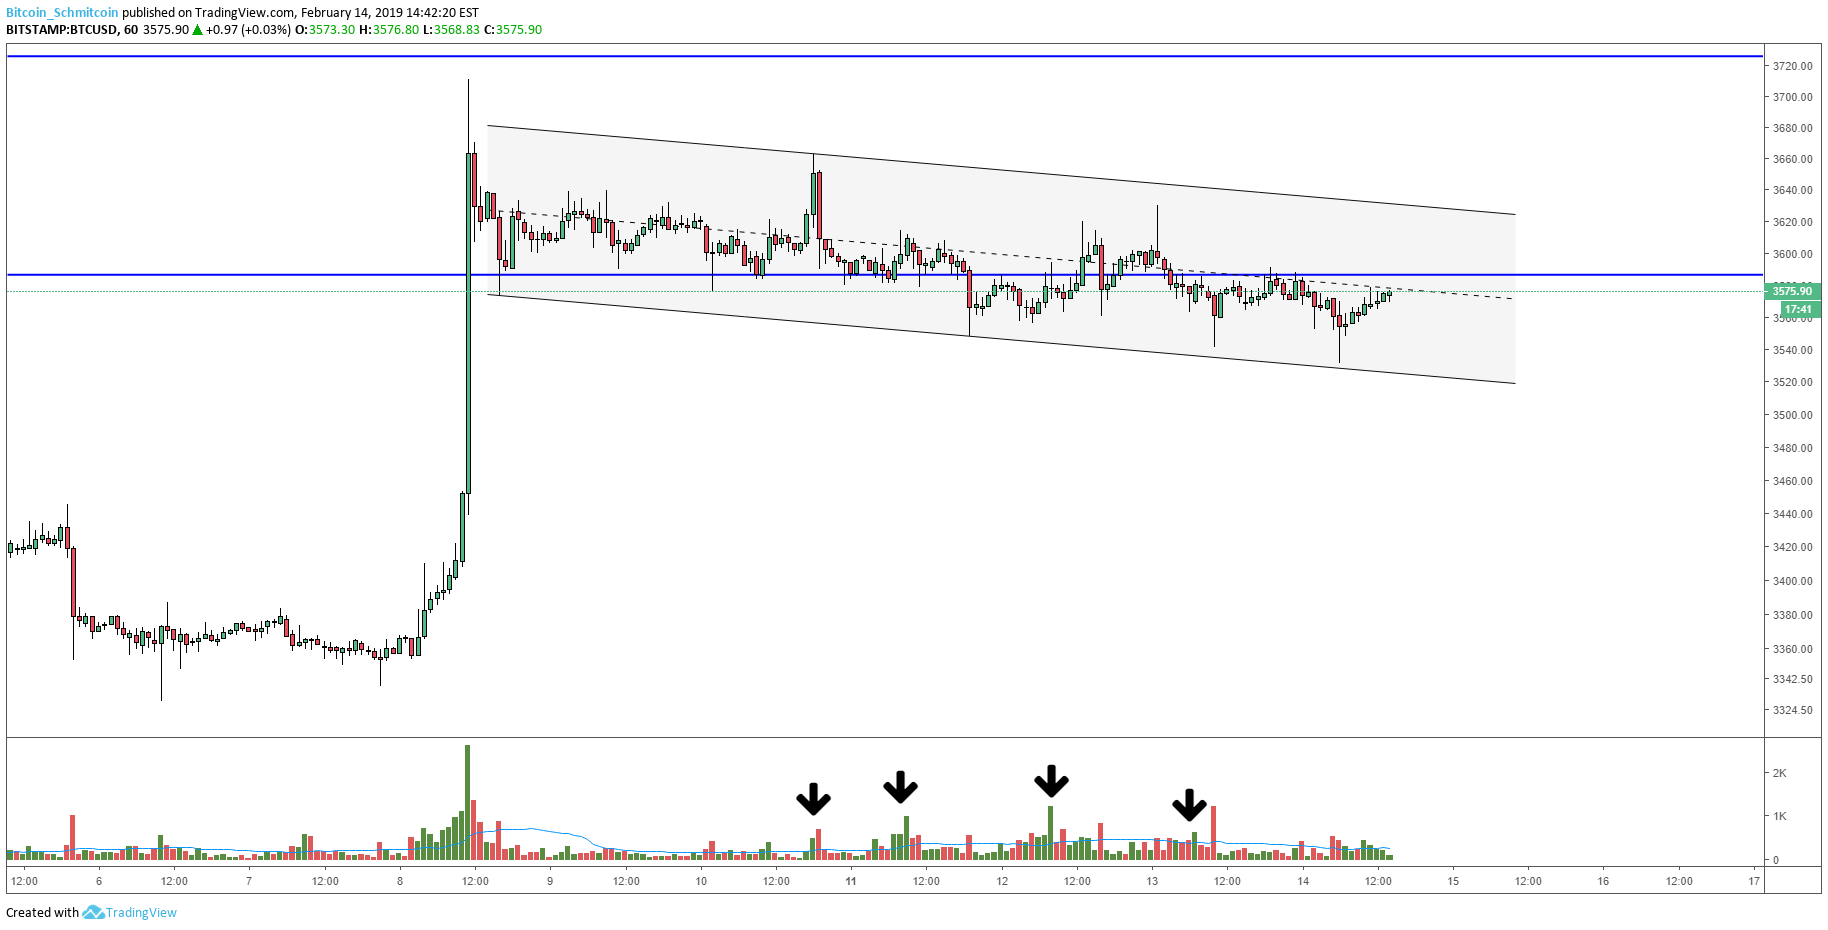
Figure 2: BTC-USD, Hourly Candles, Sustained Selling Pressure
We can see in the figure above that every attempt by the bulls to push the price upward was quickly and easily countered by bearish pressure. The highs are getting lower, and the lows are getting lower, and we can see that every attempted rally is being sold into as supply continuously surfaces.
Similar to the lower time frame trend we just discussed, the higher time frame trend is also exhibiting lower highs and lower lows. Additionally, the figure below outlines the key overhanging resistance levels we must break if we want to a sustained rally:

Figure 3: BTC-USD, Daily Candles, Overhanging Resistance Levels
Because crypto is so volatile, sometimes it helps to clear things up by looking at the closing price of the daily candles. Although wicks contain very important information, if we just focus on the closing price we can get a general idea of the macro health of the market. The figure above shows us rallying above our first key level, but it has begun to slowly drift below the level once again. Ideally, we would like to see this overhanging resistance turn into support. We are currently in the middle of testing the first level so it is unfair to say whether or not the test has failed or whether the resistance has turned into support.
If we fail to hold support at this level, I fully expect to see a test of new lows, as this has been the trend over the last few weeks:
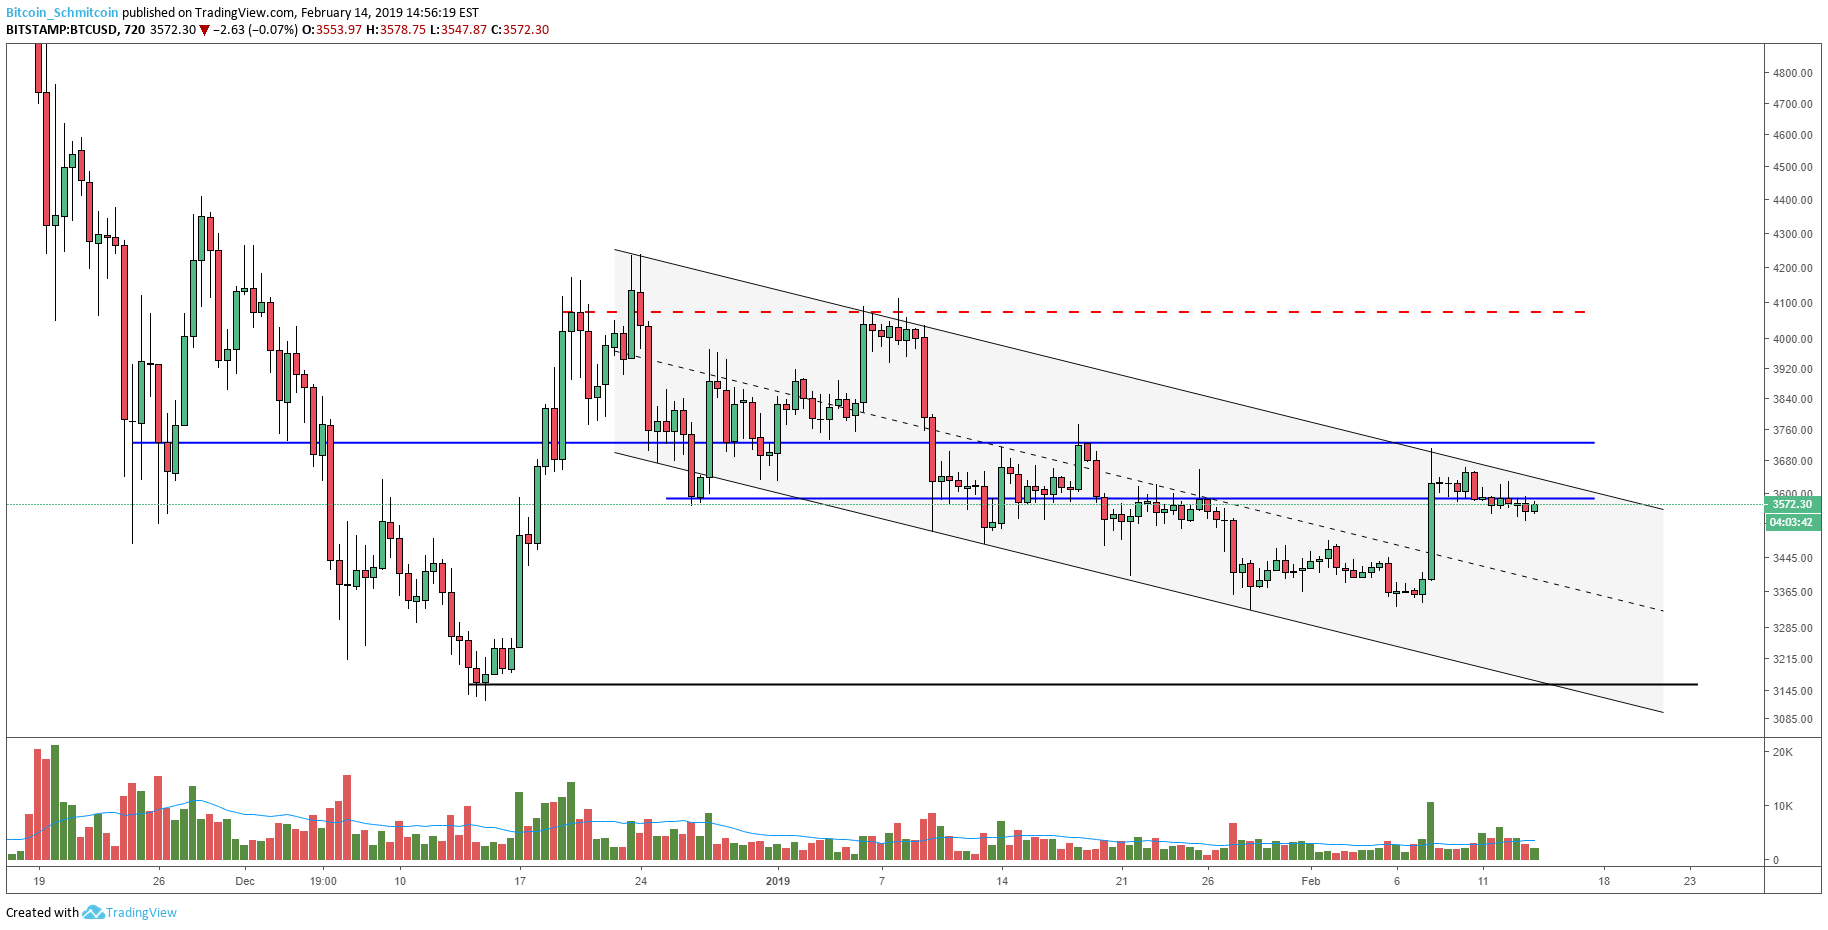
Figure 4: BTC-USD, 12-Hour Candles, Macro Supply and Demand Channel
The entirety of 2019 has been outlined by a very well-defined supply-and-demand channel. At the moment, our overhanging resistance test coincides with a test of the macro channel. A failure to maintain this level and rally to a new high will most likely yield a test of the lower part of the channel and the next macro supply level in the the low $3,000s.
Right now, bitcoin is just drifting slowly downward and somewhat sideways. It’s entirely possible we rally to new highs from here, but for now the market structure is bearish as we have failed to break resistance, push new highs and break out of the supply-and-demand channel.
Trading and investing in digital assets like bitcoin is highly speculative and comes with many risks. This analysis is for informational purposes and should not be considered investment advice. Statements and financial information on Bitcoin Magazine and BTC Inc related sites do not necessarily reflect the opinion of BTC Inc and should not be construed as an endorsement or recommendation to buy, sell or hold. Past performance is not necessarily indicative of future results.
source: http://feedproxy.google.com/~r/BitcoinMagazine/~3/0X5IgwC-lk8/


Article comments