Bitcoin Price Weekly Analysis: Sell Rallies In BTC/USD Near $5,880

Key Points
Bitcoin price settled below key supports against the US Dollar. BTC/USD may recover in the short term, but sellers remain in control around $5,880.
Bitcoin Price Analysis
This past week, we saw a nasty decline from the $6,300 swing high in bitcoin price against the US Dollar. The BTC/USD pair collapsed below the $6,000 and $5,800 support levels to enter a bearish zone. The price even settled below the $5,800 level and the 100 simple moving average (4-hours). It traded close to the $5,200 level and formed a new yearly low at $5,206. Later, the price started an upside correction and recovered above the $5,400 and $5,500 levels.
Buyers pushed the price above the 23.6% Fib retracement level of the recent decline from the $6,304 high to $5,206 low. However, the $5,550 and $5,600 levels are currently acting as hurdles. Moreover, there is a short term consolidation pattern formed with resistance at $5,550 on the 4-hours chart of the BTC/USD pair. It seems like the price may break the $5,550 and $5,600 resistances to extend the current recovery. However, there are many barriers on the upside near $5,750 and $5,880. Besides, the 61.8% Fib retracement level of the recent decline from the $6,304 high to $5,206 low is at $5,880 to act as a solid hurdle.
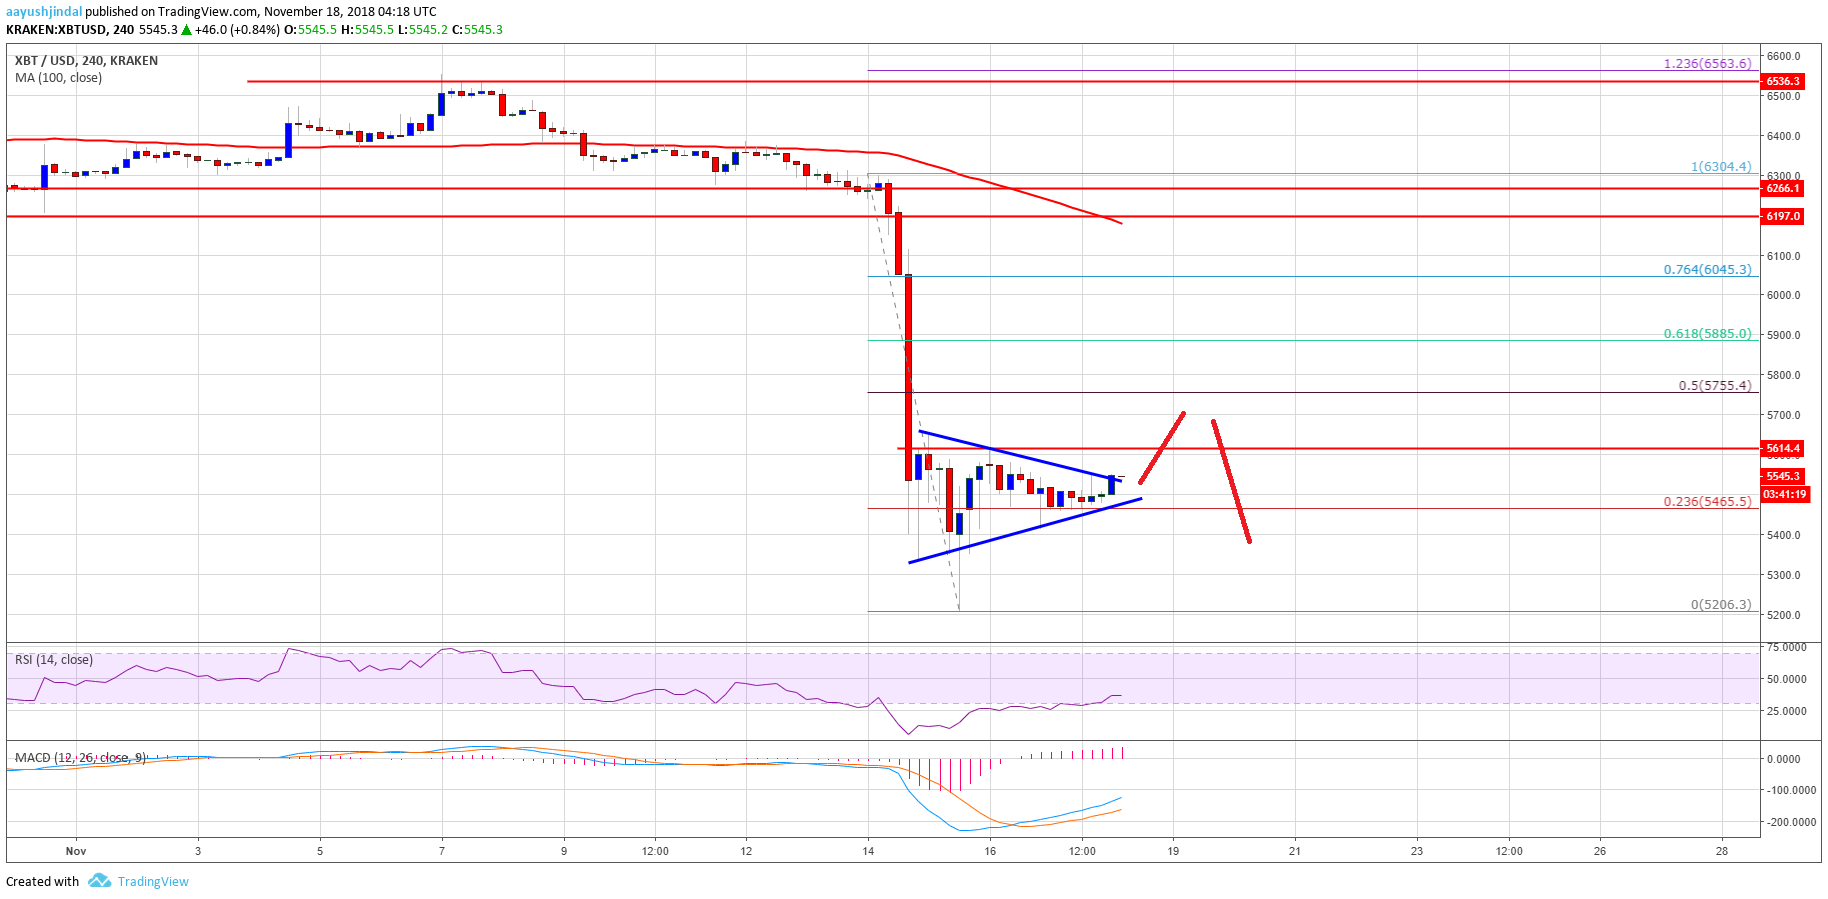
Looking at the chart, BTC price may correct higher towards $5,750 or $5,880, but it is likely to face a strong selling interest.
Looking at the technical indicators:
4-hours MACD – The MACD for BTC/USD is back in the bullish zone.
4-hours RSI (Relative Strength Index) – The RSI is currently recovering above the 30 level.
Major Support Level – $5,200
Major Resistance Level – $5,880


Article comments