Ethereum Price Analysis Sep.22: Is ETH bullish again?
On the 4-hour chart, ETH just got to the upper side resistance of the more significant descending trend line that started around May 2018, and to the 200 EMA (marked in white on the chart).
It won’t be easy to breach this resistance, but if BTC and the market keep this ongoing momentum, we might see ETH breaking up. Next resistance would be $274 – $285 and $313.
RSI is climbing to the overbought areas while supported by the 55 EMA (marked in yellow).
We do notice five waves move in this more-significant descending trend line, and the current uptrend is an ABC zigzag formation. This could be developed into a five wave uptrend if we break beyond the resistance level.
BTC has some more room for a move upward according to the Elliot wave count, so It might be good for the market and ETH is definitely included.
So a break above the resistance trend-line, as mentioned above, could be precise what manipulators will head for to bring more retail money into the markets before turning back down.
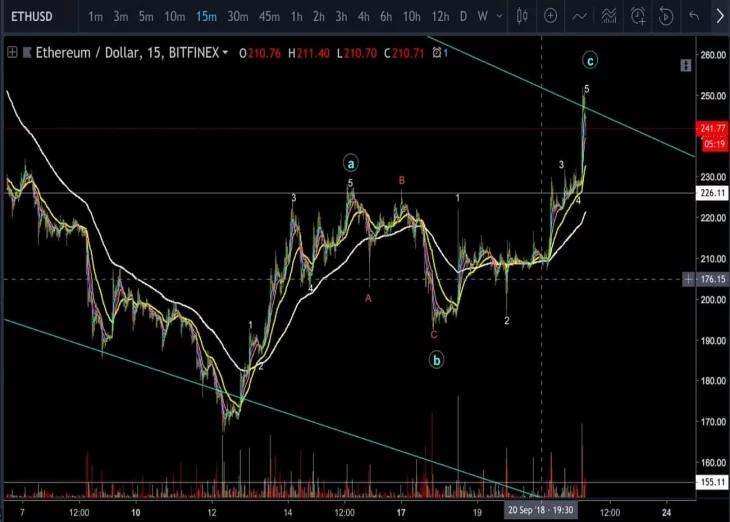
On the 15 minutes chart, we can see the ABC current uptrend correction, while the sub waves match perfectly. It would be a zigzag (535) correction type. The “C” wave could have another mini-sub wave up for the 5th wave. If we break up, followed by high volume, we will consider changing the count to a more bullish one as a more extended correction upward.
We are not jumping into conclusions of a new uptrend move at the moment, and we also suggest traders not to rush into that thought before we get a confirmation of a full five waves to move up, above the resistance.
On the 1 hour chart, we can see the scissors candle formation which might suggest the uptrend is in the stages of termination, along with RSI in overbought areas. But no negative diversions in the scene yet.
Fibonacci: The A to C Fibonacci relations are one-to-one at the moment, and we can see it continuing to 1.382-1.618 which will take ETH to the next mentioned resistance levels of $274 – $285.
Conclusion
ETH has a bit more room for an upward movement after a short sideways movement, only if bulls will show strength. However, we are still in the middle of a long-term down trend. Things look temporary bullish, but be careful.
Cryptocurrency charts by TradingView. Technical analysis tools by Coinigy.


Article comments