Bitcoin Price Analysis Nov.8: First Signs of Bullishness
On our previous BTC price analysis, we’ve mentioned the significant bullish signal which is the RSI breakout on the daily chart.
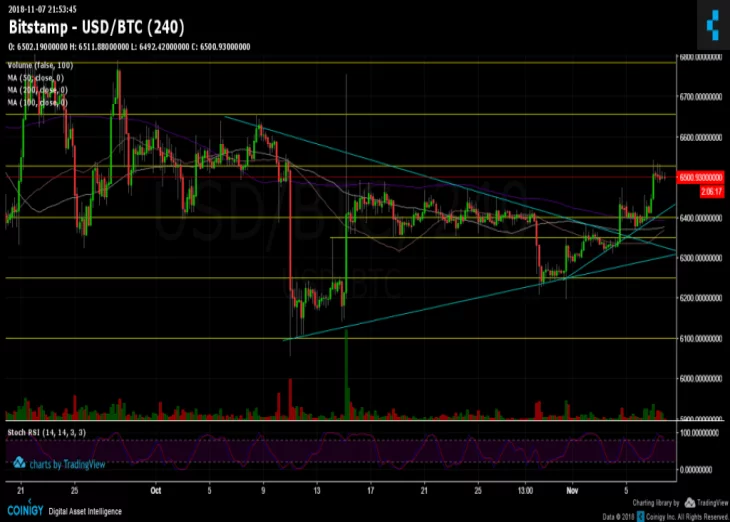
It hasn’t been long till Bitcoin passed $6500, for the first time since October 11. What might also contribute to the bullish environment is the increasing trading volume coming from South Korea. South Korean exchanges had a major role in the latest bull-run at the end of 2017.
The 4-Hours chart:
BTC/USD BitStamp 4 Hours chart
Cryptocurrency charts by TradingView. Technical analysis tools by Coinigy.


Support this Site


Article comments