Ethereum’s expected breach above $214 might face a “delay period”

A decline of 9.53 percent on 21st May was definitely less than ideal for Ethereum, but world’s second-largest digital asset did not breach any major support during the collapse. With a correction phase looming large over the collective industry, Ethereum appeared to gear up from a re-test or continued side-ways movement in the chart.
Ethereum 1-day chart
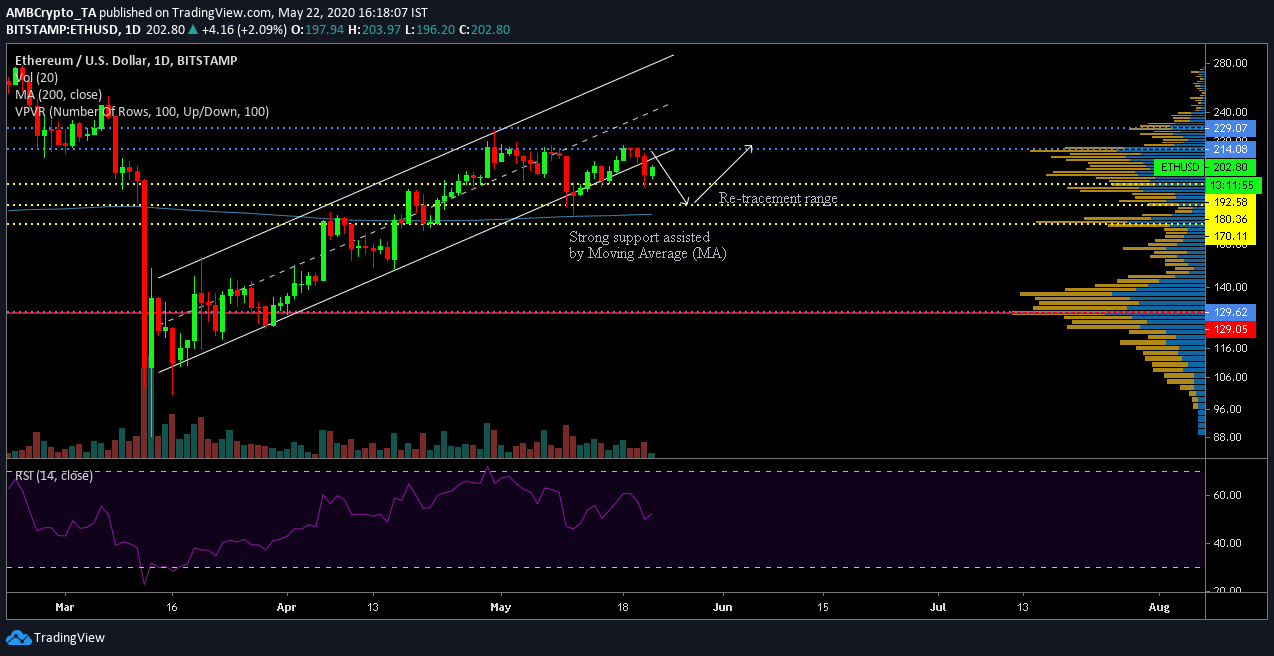
As observed in the charts, Ethereum’s movement has been in an ascending channel patter since the aftermath of March’s Black swan event. However, over the past week, the token had appeared prime for a bearish breakout as the price continued to mediate below the average-line in the channel. On 21st May, the breakout was completed as Ethereum’s valuation declined.
Now, considering the trend continues over the next week, Ethereum may find itself re-testing support at $180.36. Although long-term support remains at $170, the asset might bounce-back from above $170, since strong support is also assisted by the 200-Moving Average.
Now, according to the VPVR indicator, the trading volume is significant at current range and at $170. Hence, one of these supports might witness a retracement. Relative Strength Index or RSI also appeared pretty neutral at the moment.
The case for strong sideways movement?
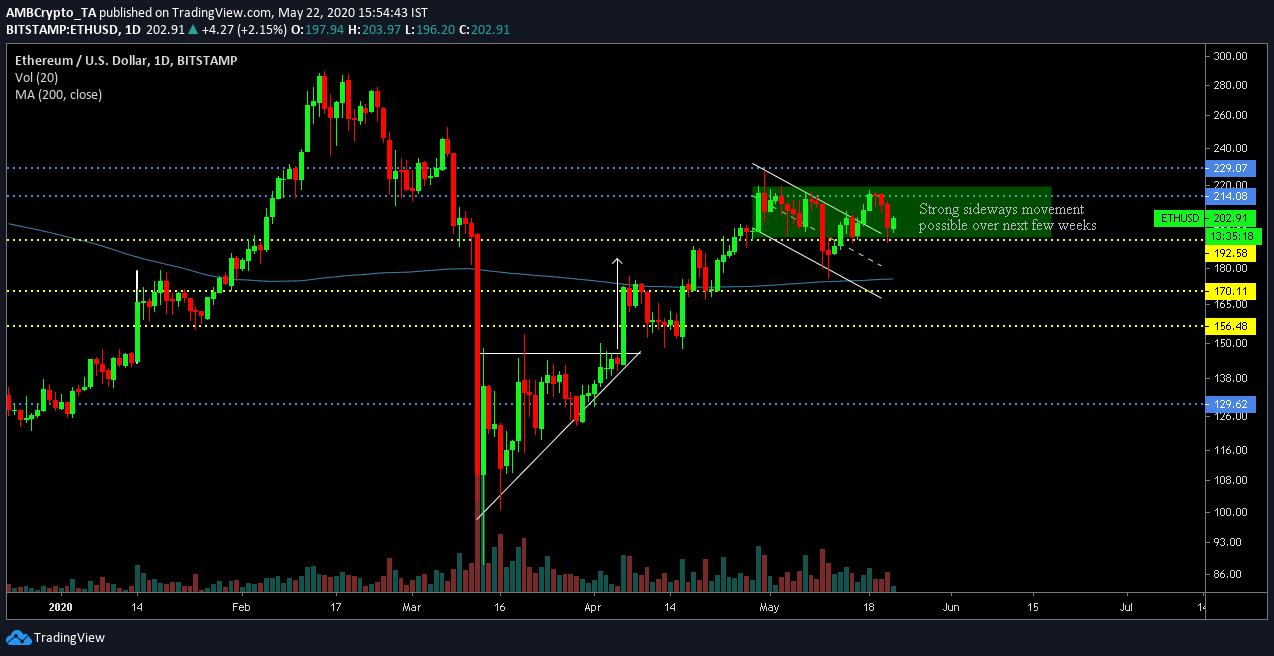
Now, on analyzing it from a different period of time, Ethereum’s descending channel also appeared to indicated a bullish breakout. The recent breakout might indicate the strong positioning of Ethereum’s price between $192 and $214. It is quite foreseeable that Ethereum might continue movement between these ranges for a prolonged period of time because facilitating a major breakout. Trading volume was consistent, increasing the chances of a solidified strong bottom.
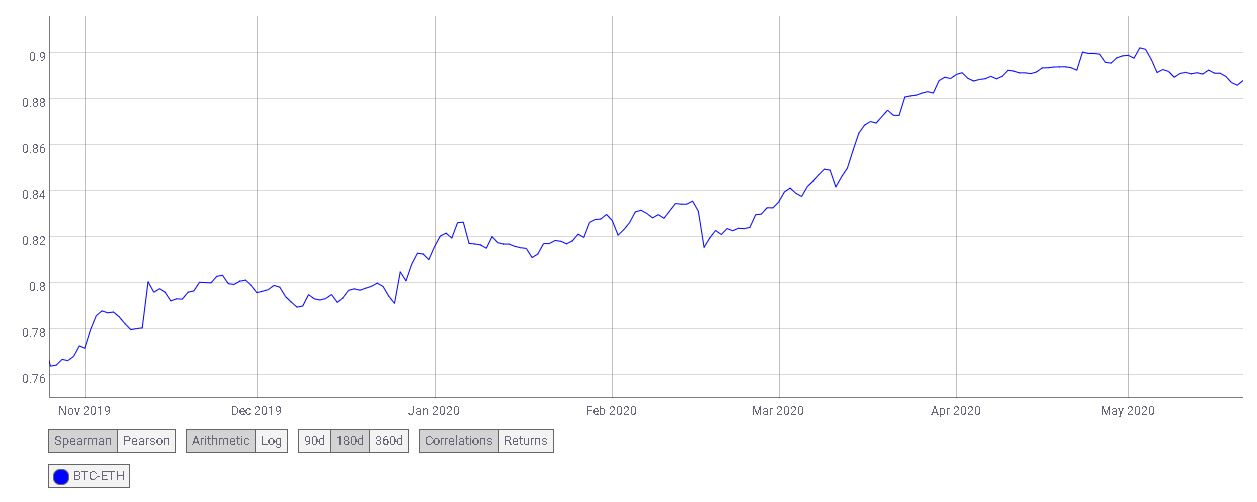
Without excluding the pull of Bitcoin, there is a continued correlation between Bitcoin and Ethereum in the chart. However, Bitcoin hasn’t dictated Ethereum’s movement since mid-April, when the asset dropped under 0.90 correlation factor. Even though in the charts it remains pretty clear, it will be interesting to analyze Bitcoin’s pull with the market momentum of Bitcoin halving.


Article comments