Ethereum price vis-à-vis Bitcoin’s roller-coaster is in for a stroll in the park

Every second-fiddle is always compared to the heavyweight. Either in valuation, price, market capitalization or importance, performance is always relative to who’s holding the cards. For Bitcoin and Ethereum the number one and two cryptocurrencies on the market, the tale is no different.
For the better part of 2019, Bitcoin had a leg-up, on not just Ethereum, but all the altcoin in the market, but the roles were reversed in 2020. In the first few months of this year, Ethereum saw a massive rise in its absolute price, and its price relative to that of Bitcoin, surging from ETH being 1.7 percent of BTC’s price in December 2019, to 2.8 percent in February 2020. But this divergent price movement was short-lived.
As the effects of the global pandemic began rattling the crypto markets, Bitcoin was pushed down in a liquidity barrage, taking down the collective cryptocurrency capitalization. Ethereum also saw a plummet, dropping down to a double-digit price for the first time since December 2018. Now, as the market begins to recover, with Bitcoin turning a YTD positive, is there a difference in the expected volatility of the two respective cryptocurrencies?
If one were to go by the strike prices of Bitcoin and Ethereum options contracts, the altcoin’s imminent future is a walk in the park, compared to the king coin’s roller coaster ride.
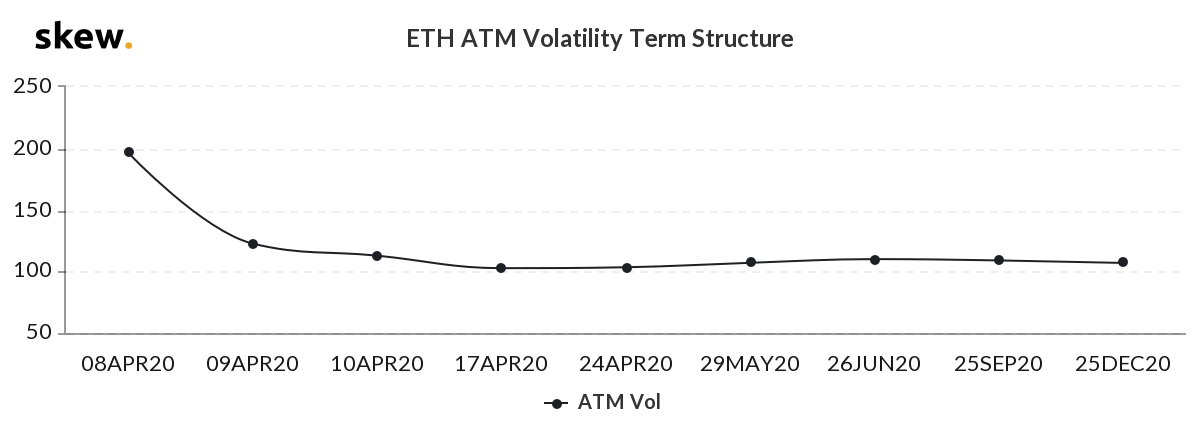
According to data from skew markets, the ETHUSD at-the-money volatility term structure is set to decline from 193.41, recorded on 8 April to as low as 121.22. In the coming months, all the way to December 2020, traders are expecting Ether’s price to be less volatile with time, with the volatility term structure dropping to as low as 106.98 for contracts expiring on Christmas Day, 2020.
The almost L-shaped curve indicates a drop in volatility, followed by a stable run, around where the volatility dropped to initially.
Further, the difference between the altcoin’s realized volatility [RV] and implied volatility [IV] bears the same movement or lack thereof. According to the IV vs RV chart, the gulf between the two has been consistently increasing post the March 13 crash. Based on this, traders are of the assumption that the most volatile period of Ethereum is over, and what’s to come will be relatively less volatile.
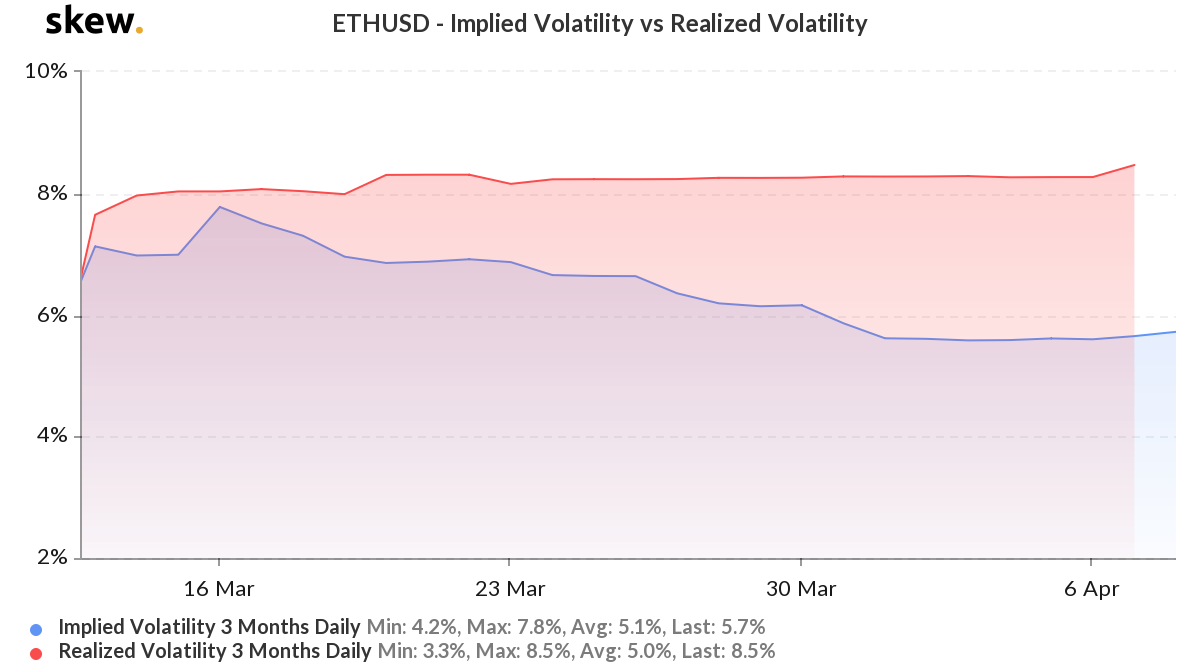
As things stand, the 3-months RV for Ether is 8.5 percent and rising, while the 3-months IV is at 5.7 percent. Less than a month ago, the two were at 8 percent.
Needless to say, the expected movement in Bitcoin’s price, based on the king coin’s options’ pricing, over the next few months is due to the third reward halving. Based on this price-conscious event, traders are expecting Bitcoin’s volatility to remain low till the first half of May, and then increase massively, as the incentives of miners align with the spot price of the cryptocurrency.


Article comments