Bitcoin’s active supply figures touch new highs despite downside correction

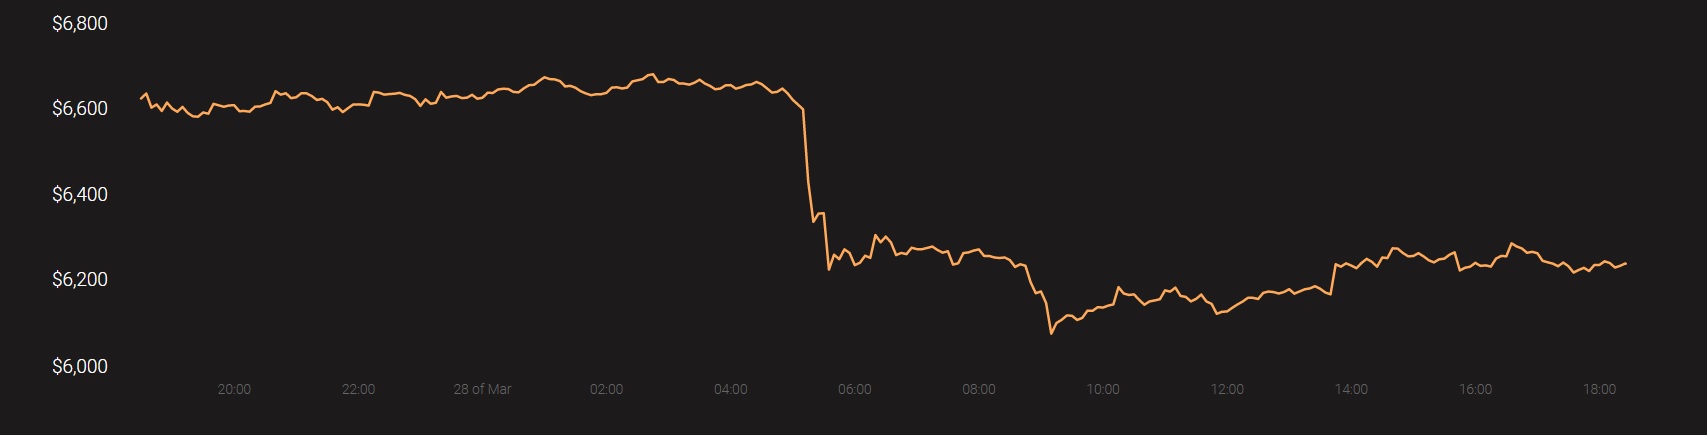
The severe market correction has cut short Bitcoin’s bullish surges after the king coin plunged to $6,287, at press time. This move towards the downside was propelled by a drop of 6.30% over a period of 24-hours. Despite nearing the crucial $7,000 psychological level, the king coin’s price appeared to have lost momentum at the $6,200-range.
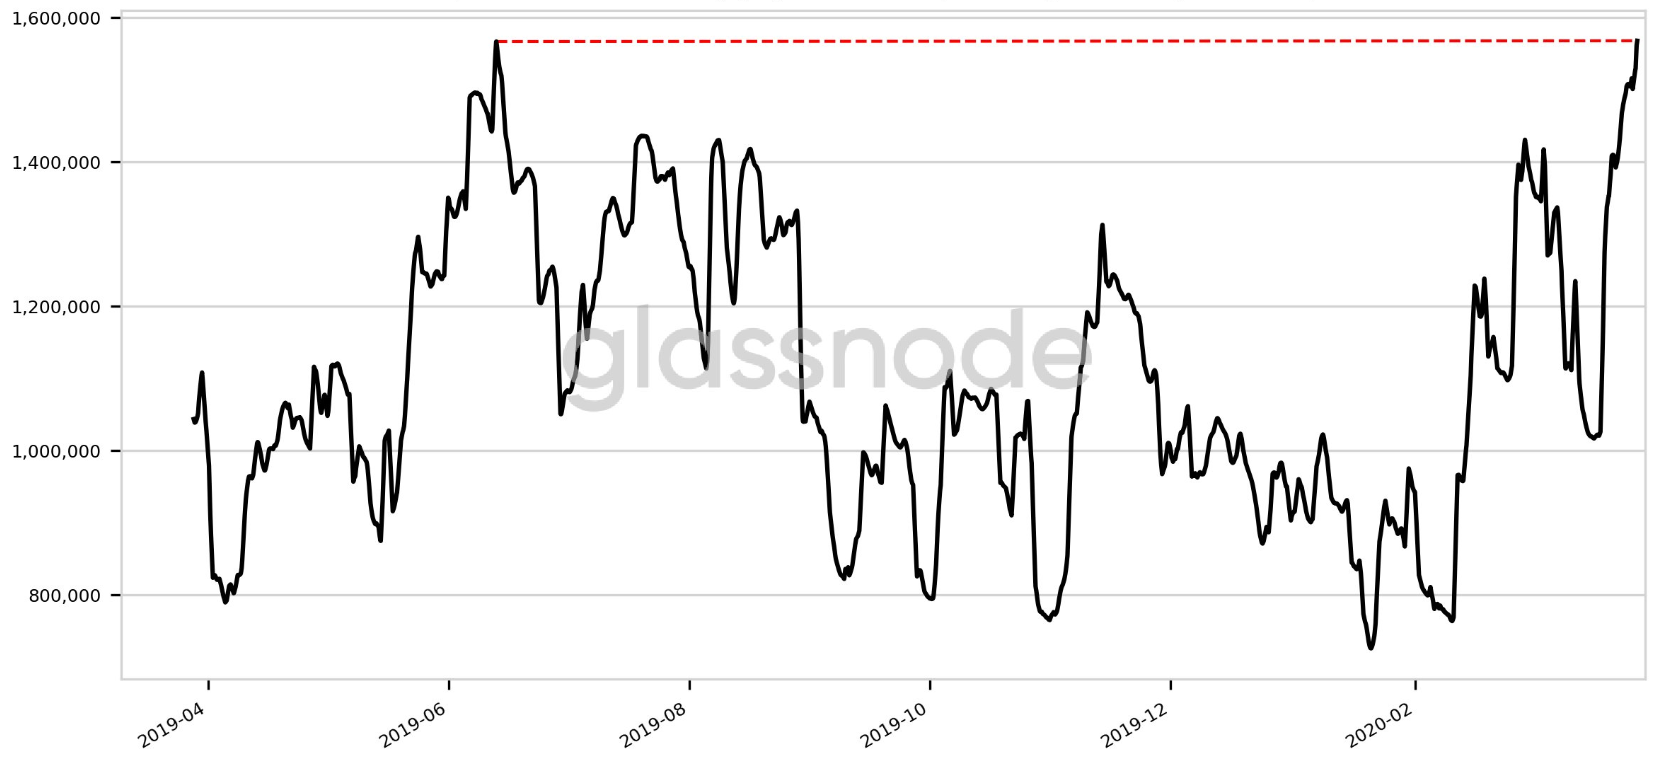
In the latest development for Bitcoin’s active supply, the 1w-1m (1d MA) touched a year high of 1,568,168.943. This was noted by Glassnode Alerts. According to the Glassnode chart, this figure had dropped significantly below 1,200,000 when Bitcoin had crashed terribly over the course of 12-13th March.
The present price action is, however, quite different. After consolidating above $6,500 for nearly a week, the king coin’s price went for a toss and was on a downward spiral once again.
Bitcoin’s active supply in terms of the 3y-5y [1d MA] also reached a 6-month high of 1,049,940.778. This was followed by a steep increase that appeared to have followed Bitcoin’s price revival. However, with respect to this metric in 5y-7y [1d MA], the active supply figure touched a 6-month low of 1,179,103.006.
Interestingly, it had been previously observed that 75 entities hold 10,000 or more Bitcoin in active addresses, while only 7 entities hold 100,000 or more and these all are cryptocurrency exchanges. In the order of the amount held, these exchanges were Coinbase, Huobi, Binance, Bitfinex, Bitstamp, Kraken and Bittrex.
Additionally, in terms of hodling dominance by crypto-exchanges, a large amount of the current Bitcoin supply is held by platforms and leaves no trace on-chain when traded within the same exchange. This was previously observed by the blockchain analytics firm Arcane Research.


Article comments