Bitcoin difficulty & price’s overlooked connection can be used to predict bottoms

Bitcoin difficulty saw one of the largest resets recently and this was a result of a 50% plunge in price. However, the statement is not as simple as it seems as the drop in price contributed to a lot of miners operating at a loss, causing them to shut off mining rigs. This would eventually lead to a decrease in hash rate, leading to the difficulty adjusting accordingly.
Even with the above explanation, there is more to it than what meets the eye to the recent difficulty adjustment. In fact, difficulty drops like these have happened often in Bitcoin’s lifespan. A total of 52 drops in difficulty have been witnessed in Bitcoin’s lifespan; off these, there were some that were minor adjustments, while others were major. The following chart shows the three-largest drops, with all the other drops to put things in perspective.
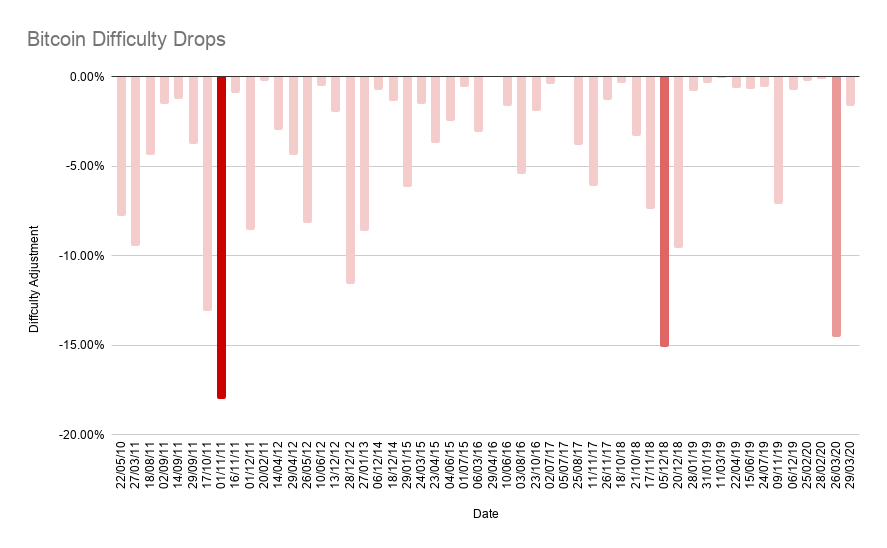
The chart shows difficulty adjustments in terms of percent change, which vary both positively and negatively. The difficulty change on 18 July 2010 was a whopping +300%, the highest positive difficulty adjustment. Albeit fewer in number, there have been negative resets in difficulty as well.
Bitcoin mining difficulty is a way to make sure that the number of Bitcoins being generated [miner reward] remains the same at all times, no matter the total amount of hash rate. The price varies in tandem with the hash rate, difficulty, since the price decides whether miners enter or exit, thereby determining the difficulty. However, the connection between the price and difficulty is a two-way street, meaning, a substantial drop in price could alter the difficulty or an equally substantial drop in difficulty could push the price to react accordingly.
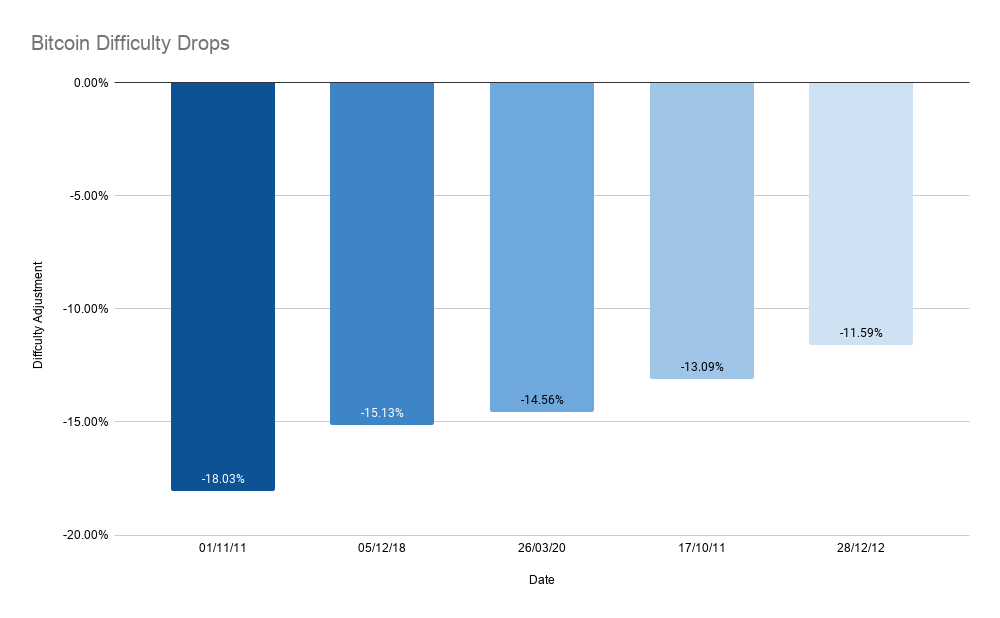
Hence, out of a total of 52 negative drops, only 5 were substantial enough to matter or affect the price of Bitcoin. All of these 5 drops in difficulty ranged higher than 10%. Arranging them based on the extent of the drop, -18.03% was the steepest drop in difficulty. This took place on 1 November 2011; however, this was not the first drop. On 17 October, the same year, a drop of -13.09% was observed, which, when compared, was the 4th largest drop in difficulty.
The second-largest drop came recently during the “hash wars” in 2018. This drop was -15.13% in magnitude and took place on 5 December 2018. Following this was the most recent drop in 2020, one that extended all the way up to -14.56%, making it the third-largest drop in Bitcoin’s difficulty. On the other end of the spectrum, a -11.59% drop in difficulty was seen on 28 December 2012.
The recent difficulty adjustment was definitely due to the drop in price; however, it can be observed that every difficulty adjustment above 10% signifies the start of a new trend, a cycle bottom of sorts.
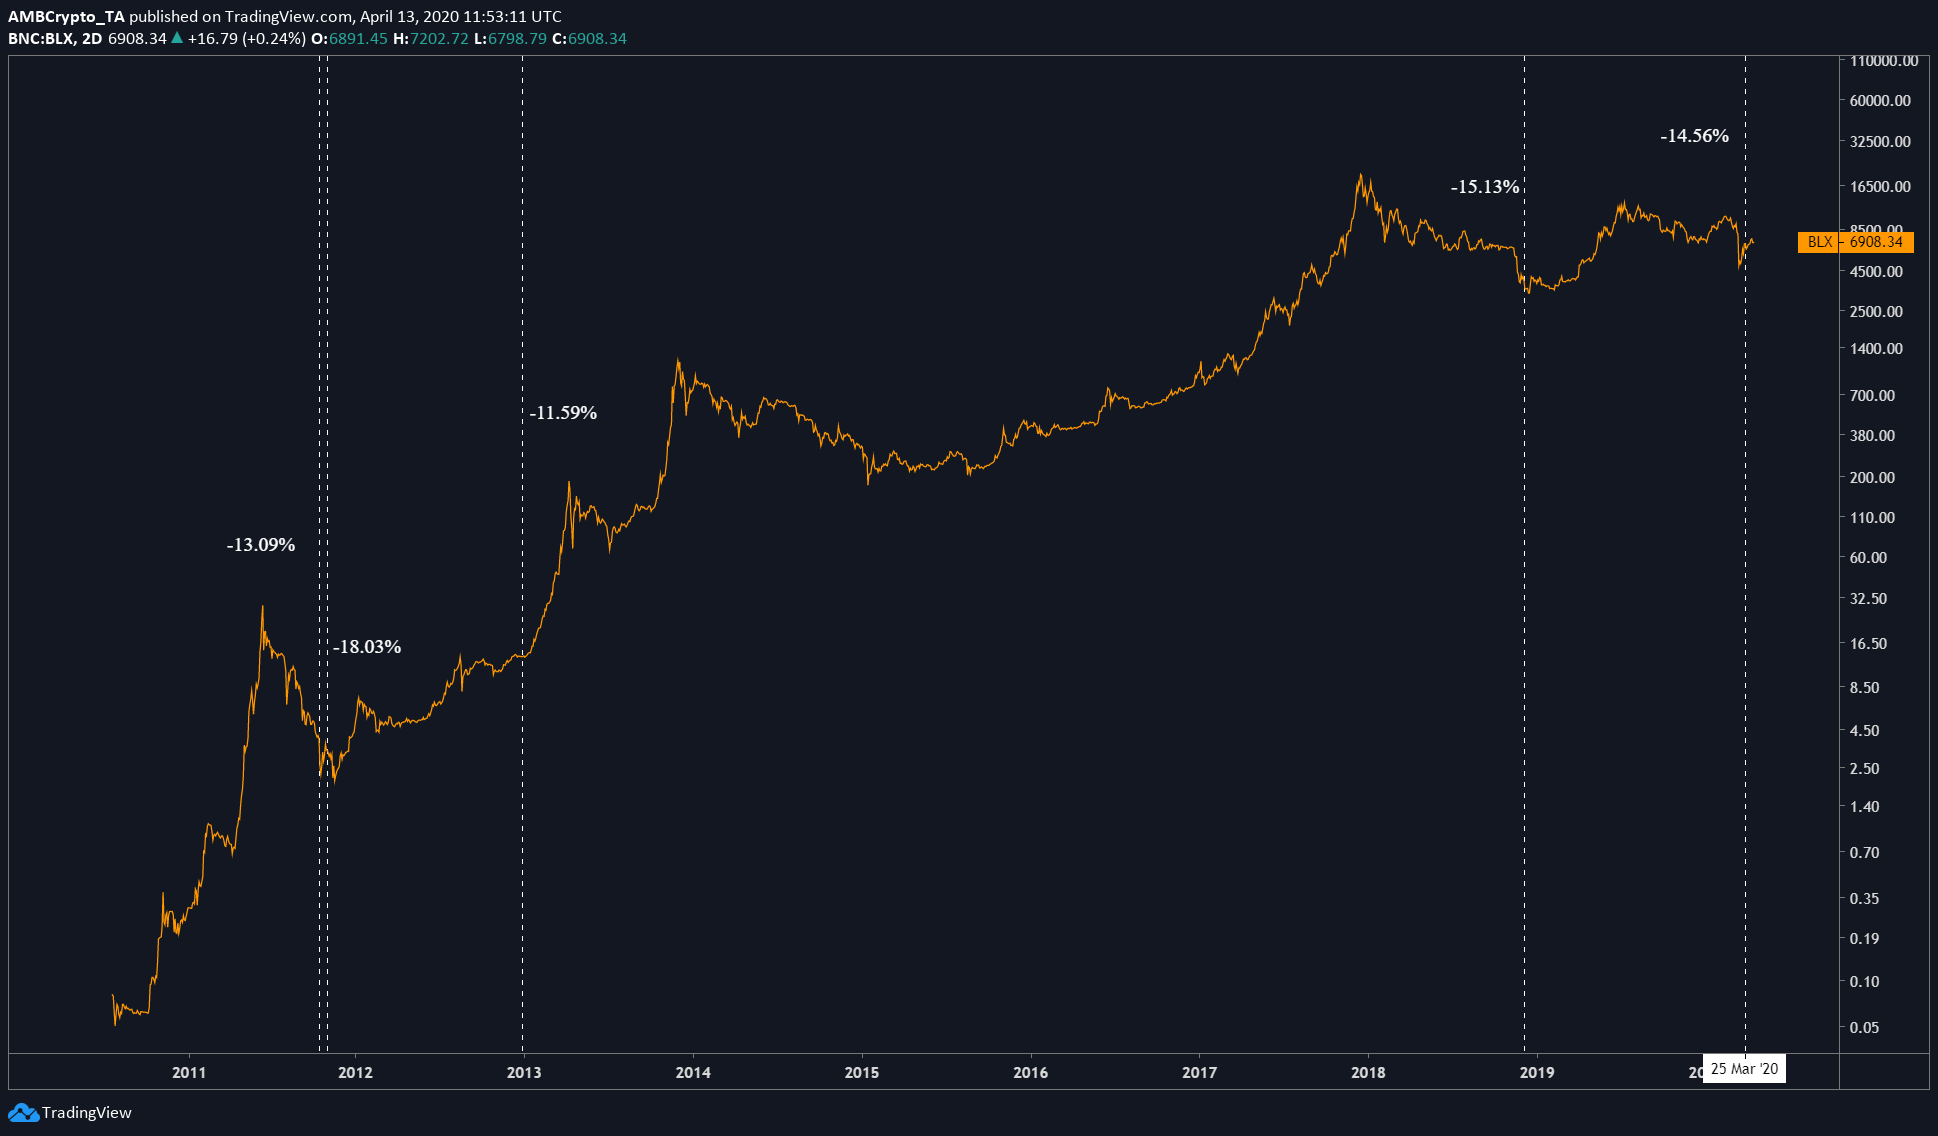
The 17 October 2011 difficulty drop [-13.09%] and the 01 November 2011 drop [-18.03%] were both before the 1st Bitcoin halving. So, a drop in difficulty was obvious; however, both these difficulty drops were just before Bitcoin bottomed in 2012, making way for a rally.
The 1st drop pushed the price down by -40.53%, followed by a 7.16% price drop after the second adjustment. However, on 13 December 2011 and 01 January 2012, the difficulty had a positive adjustment of 5.90% and 7.83%, respectively. The price surged by a whopping 252% after the second positive adjustment in difficulty.
The 28 December 2012 difficulty drop [-11.59%] was an anomaly in that the price did not drop with it. However, like the ones before it, this adjustment paved way for a rally, one that pushed Bitcoin from $13 to $268, a 1953% surge. The “anomaly” of this difficulty drop could most likely be due to the large-scale introduction of ASIC miners.
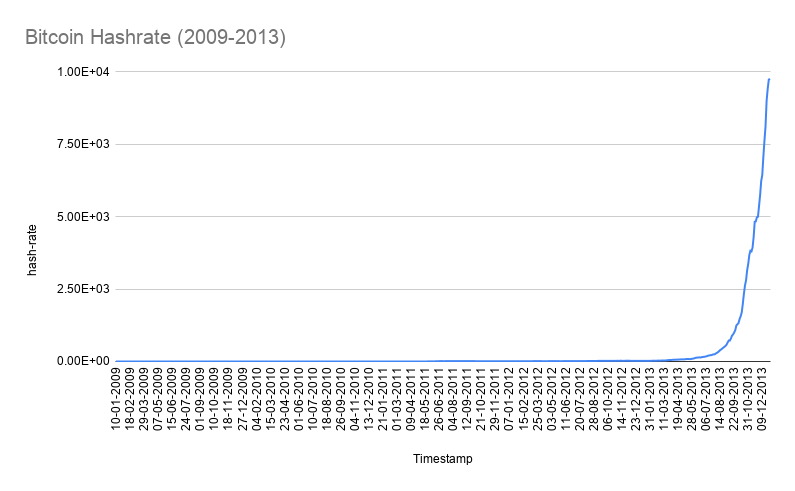
In early 2011, CPU and GPU miners were starting to upgrade their rigs and in June 2011, FPGA [Field Programmable gate arrays were born] were all the rage. Butterfly Labs [BFL] were the first to announce an ASIC product at the time. However, the drop in difficulty could be due to the launch of a purpose-built mining rig by a company “ASICminer,” one that raised funds online and produced chips by 31 January 2013.
Perhaps, the shift from GPU mining into ASIC mining caused a drop in difficulty because from 2012 to 2013, the hash rate rose exponentially.
The next difficulty drop [-15.13%] took place on 5 December 2018, during the “hash wars” when Bitcoin Cash split into Bitcoin ABC and Bitcoin SV. It was when Roger Ver of the Bitcoin Cash camp disagreed with Craig Wright, the self-proclaimed Satoshi Nakamoto. This caused both camps to relocate their hash power from Bitcoin to their respective coins.
However, this too was light at the end of the tunnel since the price went from $3,120 to $13,800, a 339% surge after the price dropped by 50.46%.
13 March 2020 was when the price drop of 50% came to an end; a few days later, on 26 March, the mining difficulty adjusted by dropping by -14.56%, making it the third-largest drop in the history of Bitcoin.
The last 4 drops in difficulty have suggested one thing – a temporary bottom for Bitcoin, which is followed by a surge of different proportions. So, if the surge were to take place now, this would be the best time to buy Bitcoin.
To make things more appealing, the 3rd Bitcoin halving is also around the corner and the economics of halving dictate that the price of Bitcoin is due for another rally. Considering the 2017 rally, it has been more than 2 years; hence, even without the halving around the corner, BTC is long due for another rally.
So, to sum it all up, Bitcoin difficulty and price have a deeper connection than previously anticipated. If anything, the latest drop will prove that drops in difficulty [greater than -10%] are usually indicators of local cycle bottoms.


Article comments