XRP/USD Technical Analysis: Price to stand still after a short bearish run

In the current state of the cryptocurrency market, XRP, the third-largest coin on the index, is not showing much fluctuation in its price trend. At the time of writing, the token was down by 0.15%, trading at $0.507 with a market cap equivalent to $20.2 billion. The total 24-hour trading volume was observed at $332.2 million.
1-hour:
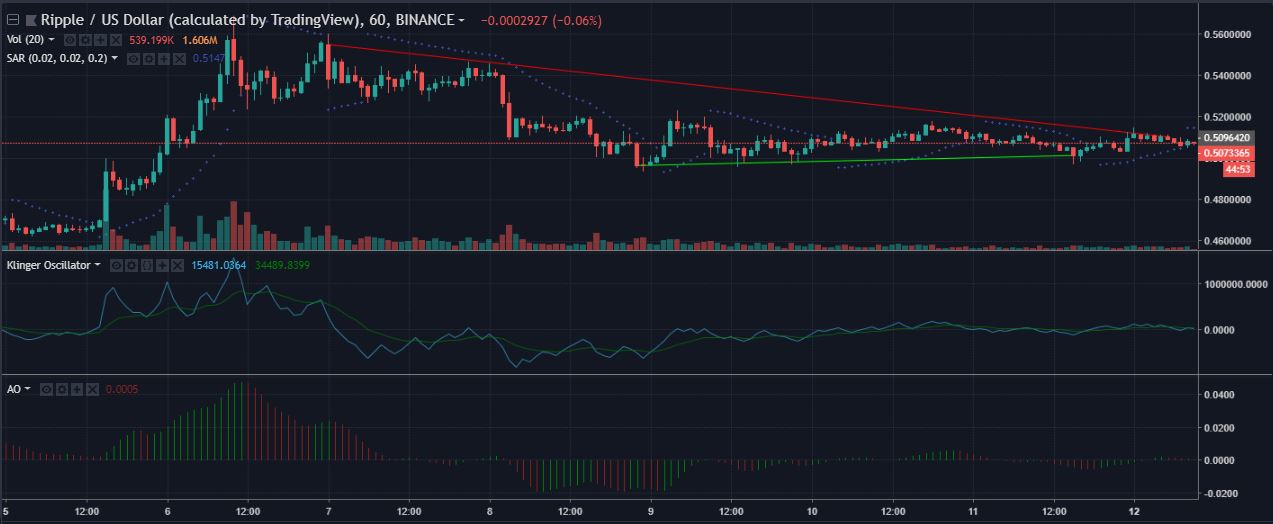
In the one-hour scenario, the trendlines are ranging from $0.55 to $0.51 [downtrend] and $0.49 to $0.5 [uptrend]. A trend breakout is imminent as evident by the concentration generated in the XRP price.
The Parabolic SAR is currently suggestive of a bear run for the cryptocurrency. The dots are placed above the candlesticks, pointing at a downtrend prediction.
The Klinger Oscillator has made a bearish crossover by the signal line. The indicator is moving further down to take a walk on the bear’s turf.
The Awesome Oscillator is also flashing red to agree with its fellow indicators. The bars are currently indicating an unhealthy price trend for Litecoin.
1-day:
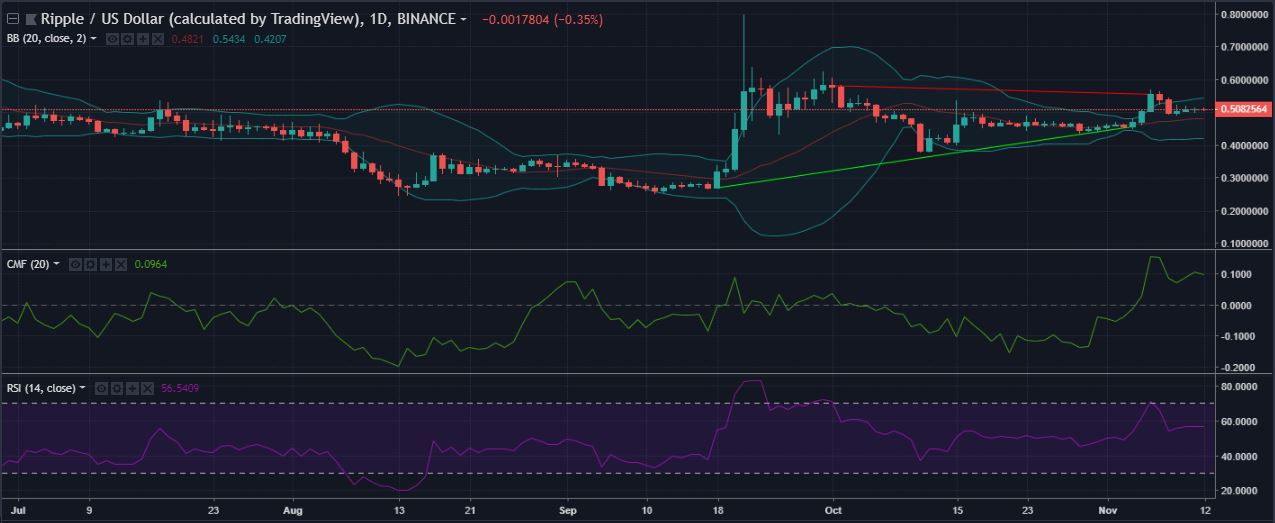
The one-day chart of XRP depicts a downtrend from $0.58 to $0.55 and an uptrend from $0.27 to $0.45. In the long run, the possibility of a trend breakout is not visible as of now, as there is still space for the trendlines to intersect.
The Bollinger Bands just returned from a narrow path and are widening its horizons to predict higher volatility in the XRP price trend.
The Chaikin Money Flow indicator is gallivanting in the bull’s arena and flashing a green signal at the price trend. However, the prediction is not confirmed as the reading line is moving downwards, despite being above the 0-mark.
The RSI is projecting a bullish outlook on the matter. However, the indicator has taken to a neutral approach after returning from a daringly bullish stance.
Conclusion
In the technical analysis, the indicators have delivered a mixed response on the price prediction. While the indicators in the one-hour chart are looking bearish, the other indicators have either suggested a bullish or neutral prediction on the subject.


Article comments