XRP/USD Technical Analysis: Bear market pulls down token; no respite in sight

XRP, the second-largest cryptocurrency by market cap, has not been spared by the bear market as the prices of XRP are desperately trying to stay above the $0.30 line.
The market cap for XRP is holding at $12.152 billion, and the 24-hour trade volume is at $290.01 million. Most of the volume for XRP is coming from Japanese exchange Bitbank via trading pair XRP/JPY, which contributes $30.78 million of the total trading volume.
1-hour
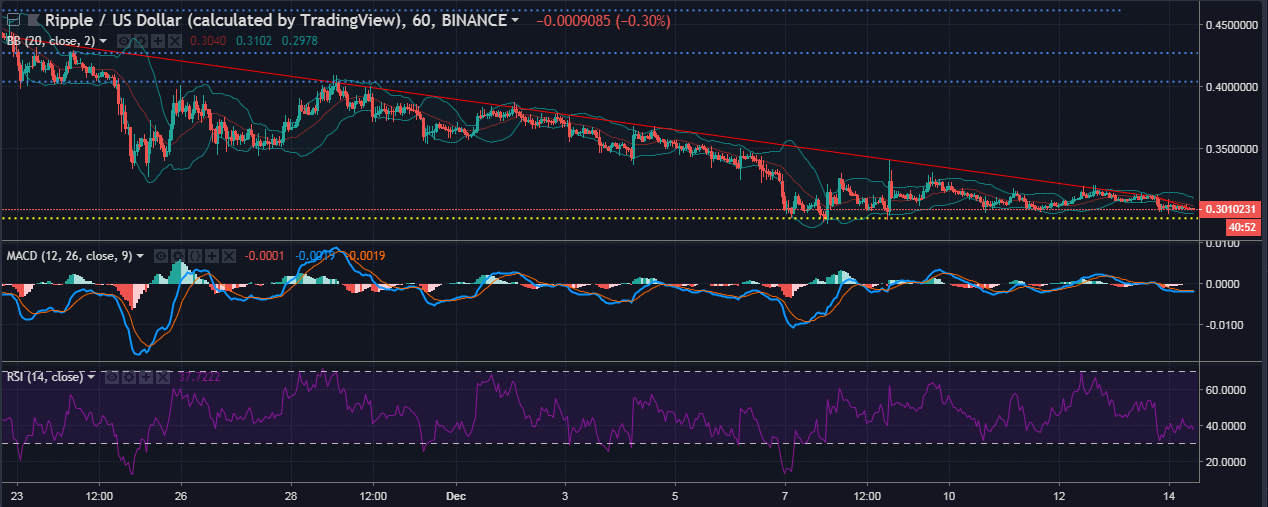
XRP prices, as seen in the chart, show a rather sad state that most of the cryptocurrencies are in. The uptrend has long been lost in the history of bull runs, while the downtrend extends from $0.4394 to $0.3021. The prices are holding the support at $0.2940 steady, with resistance points seen hanging at $0.4040 and $0.4270.
The Bollinger Bands indicate a bearish outlook for XRP in the one-hour chart as the prices are hanging below the simple moving average. The bands are contracting, which indicates that the volatility has reduced.
The MACD indicator is also depicting a bearish presence for XRP markets as the lines have fallen below the zero-line in a bearish crossover.
The Relative Strength Index is trying to stop free-falling but has been setting up lower lows instead.
1-day
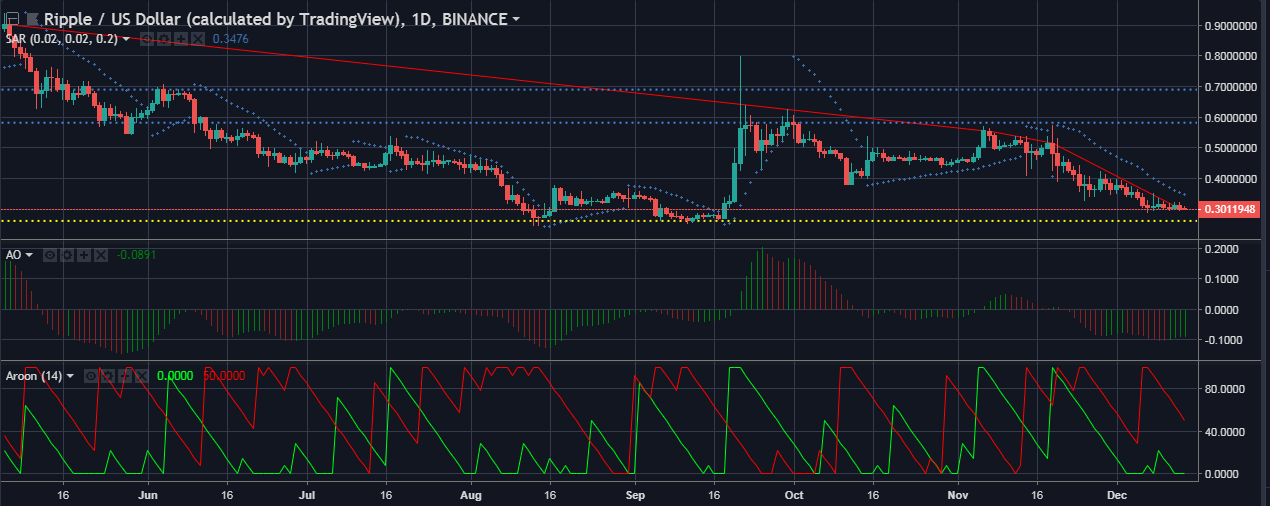
The one-day chart also looks as bleak as the one-hour chart as there is no uptrend to be seen. The downtrend, however, extends from $0.9027 to $0.3119. The support for the one-day chart is seen at $0.2627, while resistance lines can be seen at $0.5821 to $0.6899.
The Parabolic SAR markers are seen materializing above the price candles, which indicates a bearish pressure to the price candles.
The Awesome Oscillator shows a transition of red lines into green, which means that the prices are increasing, but the lines are present below the zero-line in a big-picture point of view, which means that the signal is still bearish.
The Aroon indicator shows the Aroon downtrend is seen bouncing at 100-line, which means that the downtrend for XRP has overpowered the uptrend, and that is an overall bearish sign for XRP.
Conclusion
The one-hour chart for XRP shows that the bears are in control of the market, which is, in turn, depicted by the indicators MACD, Stochastic, and the RSI. The one-day time frame also shows massive bearish signs as indicated by the SAR, Awesome Oscillator, and Aroon indicators.


Article comments