XRP surges over 5% in a day; beaks crucial resistance as price escapes bear trap

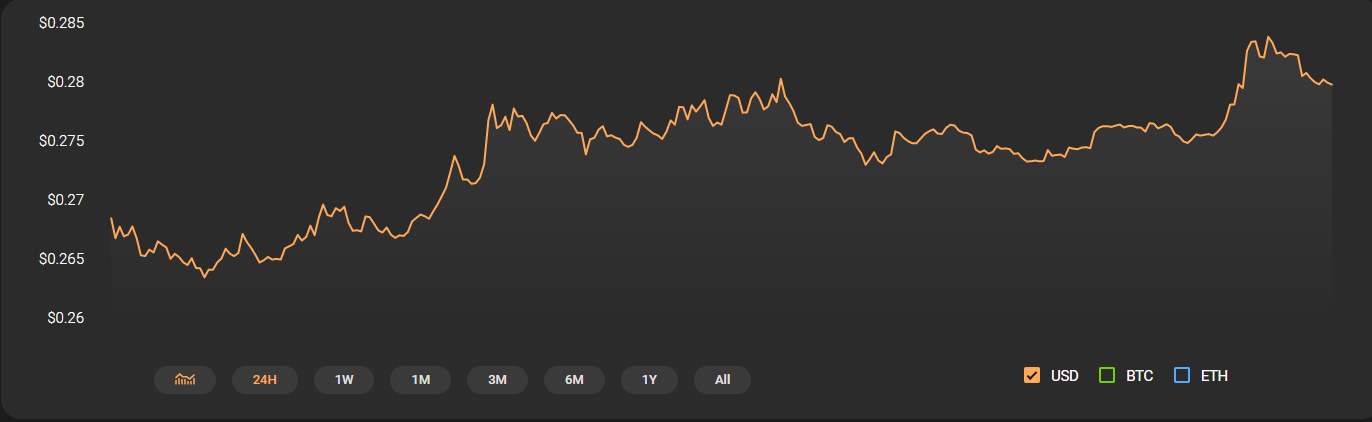
XRP has climbed higher surpassing major resistances and has been the best performing asset in the latest rally. At the time of writing, Ripple’s native coin was priced at $0.28 after a breakout on the positive sign and continued to retain its position as the third-largest cryptocurrency. The coin rose by 5.75% in the last 24-hours and held a market cap of $12.12 billion. Additionally, XRP recorded a 24-hour trading volume of $1.96 billion. Binance dominated most of the overall coin’s trade with the trading pair XRP/USDT leading the game with a trade massive volume of 26.2%.
XRP one-hour Chart:
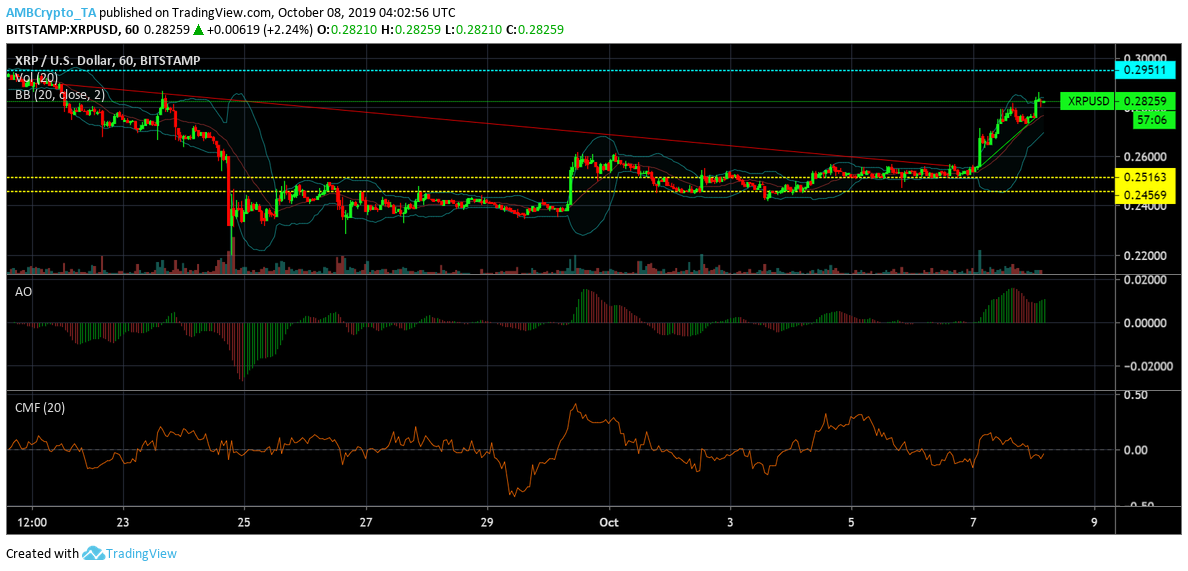
The candlestick arrangement exhibited a steep uptrend from $0.255 to $0.275 on XRP’s one-hour chart following the breach of a crucial resistance along the way. XRP’s price registered a major downtrend from $0.288 to $0.256 right before the breakout. The immediate resistance for the coin was found at $0.295 while the support point rested at $0.251 in the XRP hourly chart. A second support level remained untested at $0.245
Bollinger Bands: The converging Bollinger Bands indicated a period of low volatility in XRP’s market following a rally on September 7th.
Awesome Oscillator: The closing lines of the AO indicator was green, suggesting a bullish phase for the coin.
Chaikin Money Flow: The CMF indicator was below the zero-line depicting a bearish picture and capital flowing out of the XRP market, however, it appeared to be making a headway above in the near term.
XRP one-day Chart:
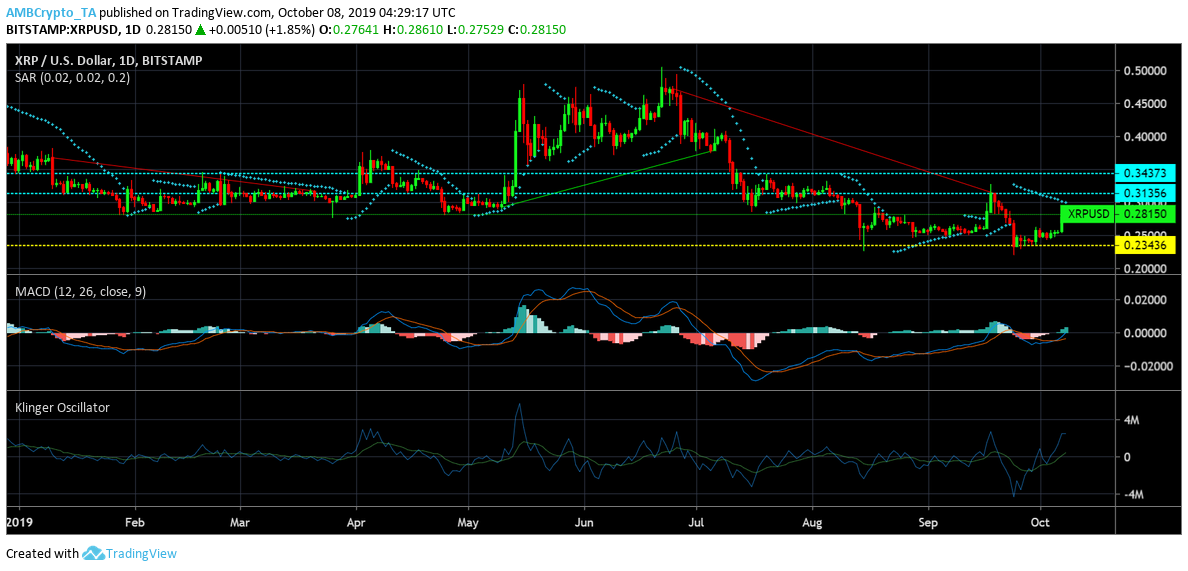
XRP’s daily chart projected a major downtrend from $0.471 to $0.313 and a minor one from $0.367 to $0.317. An uptrend from $0.292 to $0.379 was recorded in the daily chart. At point $0.312 the XRP candles found a crucial resistance, a level last seen on 18th September. If the coin breaches this point, it could find a second resistance level at $0.343. The support stood firm at $0.234 for the XRP chart.
Parabolic SAR: The dotted marker hovered above the XRP candlesticks in the daily chart. This indicated a bearish phase for the market.
MACD Indicator: The MACD line was above the signal line after sustaining a bullish cross-over, indicating a positive period for the coin.
Klinger Oscillator: The KO indicator also aligned with the bulls with the leading line above the signal line.
Conclusion: Bullish Closure
The short-term, as well as the daily chart for XRP, predicted bulls’ dominance in the coin market despite signs of capital outflow.


Article comments