Tron [TRX/USD] Technical Analysis: Prices stagnate as bear market seems to intensify
![Tron [TRX/USD] Technical Analysis: Prices stagnate as bear market seems to intensify](https://coinhub.news/img/be/be6fd7264d2c72c81054c1c943963382_730_522.webp)
Since the great fall of all the cryptocurrencies earlier this month, the market seems to be faring well in the bear market. Cryptocurrencies such as Ethereum [ETH], Moreno [XMR], Litecoin [LTC] and Tron [TRX] have started to show signs of recovery and better immunity to the bear’s attacks.
According to CoinMarketCap, at press time, Tron was trading at $0.0131 with a market cap of $869.94. The cryptocurrency shows a trading volume of $60.54 million and has seen a rise of over 1% in the past seven days.
1-hour
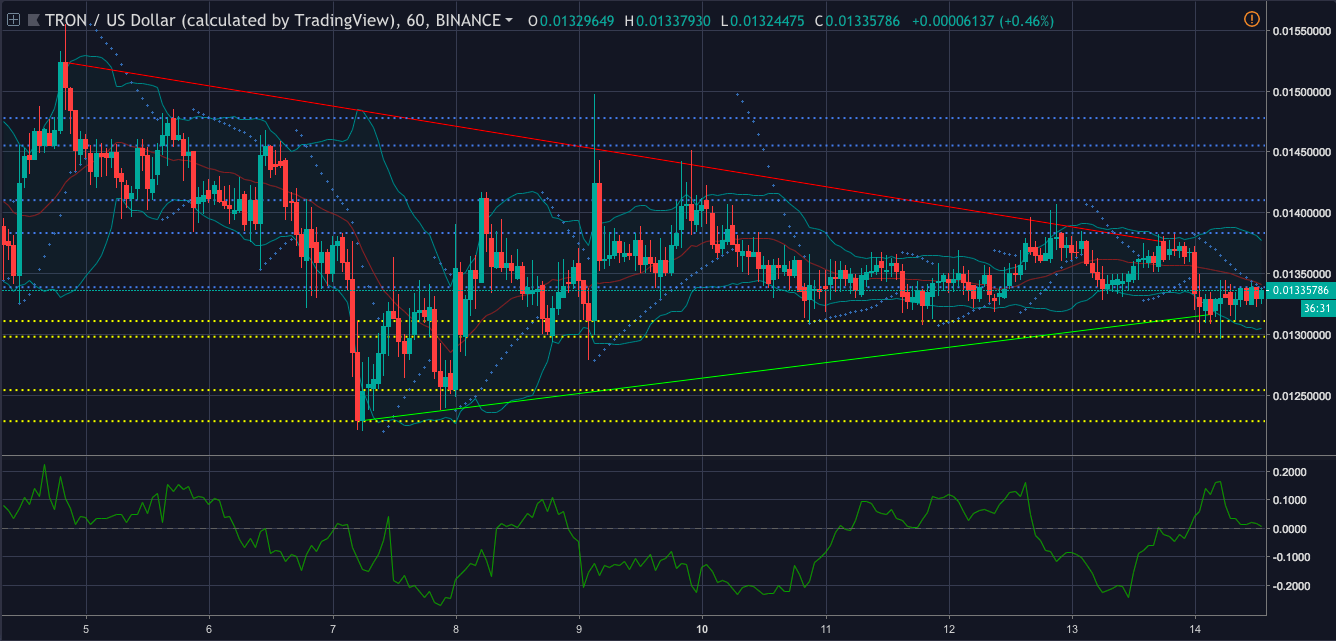
In the one-hour chart, the cryptocurrency demonstrates a downtrend from $0.0152 to $0.0137. It also pictures an uptrend from $0.0122 to $0.0131. The chart shows that the coin will have to first surpass the immediate resistance, which is at $0.0133, to get to the strong resistance at 0.0147. The immediate support is set at $0.0131 and the strong support ground is at $0.0122.
The Parabolic SAR is indicating a bearish wave as the dots have aligned on top of the candlesticks, with the intention of pushing it down.
Chaikin Money Flow is currently showing a bullish trend as the line is above the zero-mark. However, the indicator is pictured on its way to the bear’s side.
Bollinger Bands are pictured parting from each other, forecasting a more volatile market.
1-day
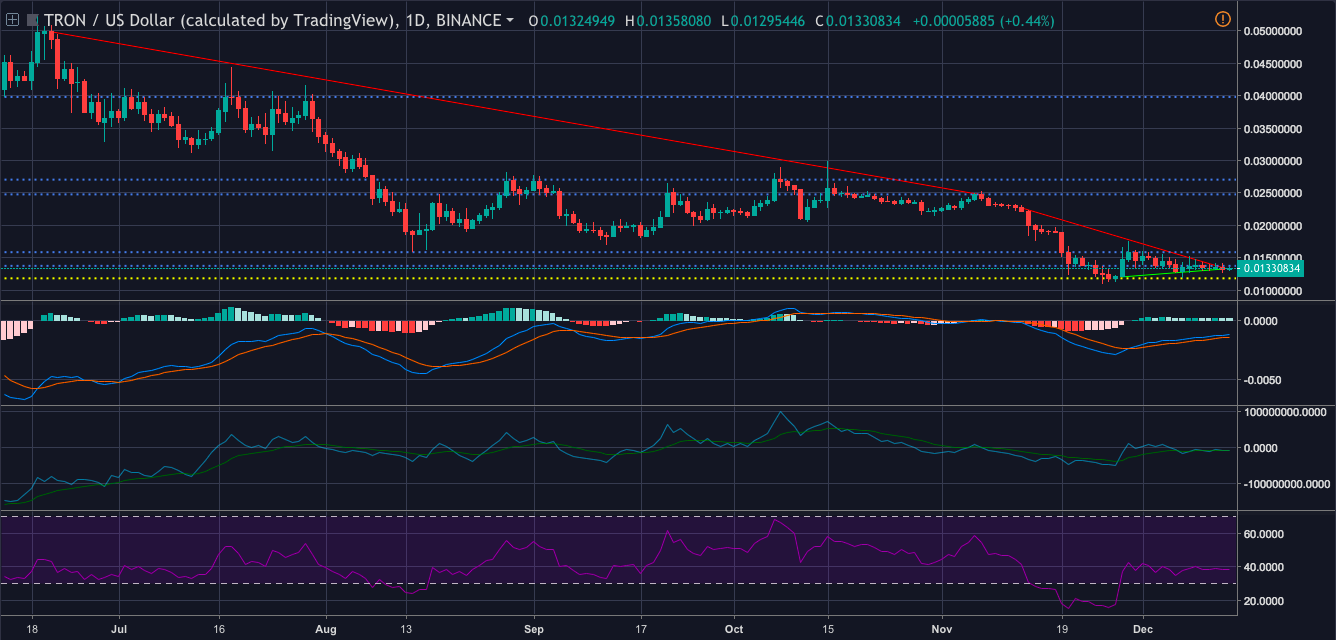
In the one-day chart, the coin shows a downtrend from $0.0498 to $0.0247. It records another fall from $0.0226 to $0.0135. The uptrend for the cryptocurrency is from $0.0120 to $0.0132.
The chart also shows that the immediate resistance has its base at $0.0137 and the strong resistance at $0.0247. The support for the cryptocurrency is at $0.0118
MACD is showing a bullish trend as the moving average line is made a crossover only to go upwards.
Klinger Oscillator, however, has chosen to take the opposite direction as the reading line has made a bearish crossover.
RSI is showing that the buying pressure and the selling pressure for the coin are currently evened out.
Conclusion
The bull and the bear have engaged in a fight, with both of them scoring equal points. The bull won the MACD from the one-day chart and CMF from the one-hour chart match. The bear, on the other hand, won the Klinger Oscillator and Parabolic SAR.


Article comments