Tron [TRX/USD] Technical Analysis: Matador rides the bull
![Tron [TRX/USD] Technical Analysis: Matador rides the bull](https://coinhub.news/img/b3/b313cd2c3ed00fcf17f6385622ee49fb_730_522.webp)
The whole cryptocurrency market has been under the bear’s terror for the past few months. Even the major cryptocurrencies in such as Bitcoin [BTC], Ethereum [ETH], and XRP failed to escape from its grip. However, the table seems to have turned, as the market is glowing green today.
According to CoinMarketCap, at press time, Tron is trading at $0.0135 with a market cap of $896.56 million. The coin shows a trading volume of $79.99 million and has seen a rise of more than 2% in the past 24 hours.
1-hour
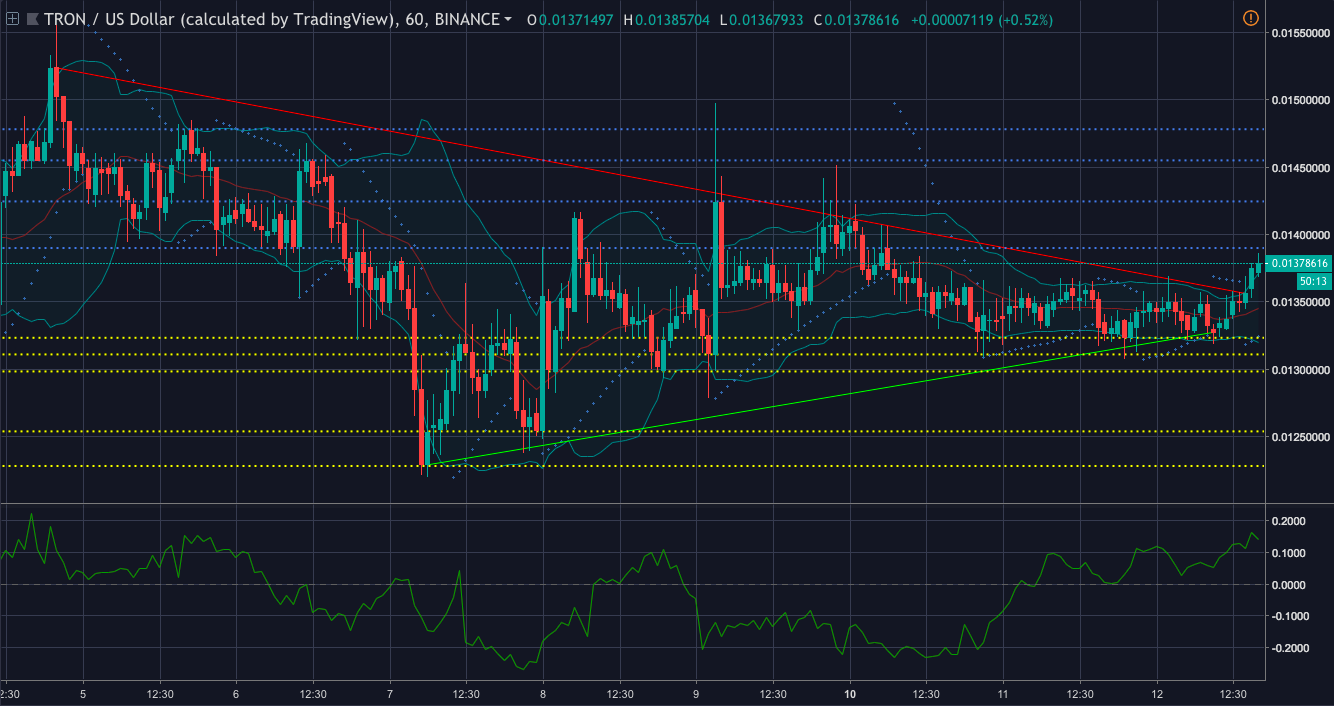
In the one-hour chart, the cryptocurrency demonstrates a downtrend from $0.0152 to $0.0135. The chart also pictures an uptrend from $0.0122 to $0.0132. The immediate resistance for the coin is at $0.0138 and the strong resistance is placed at $0.0147. It shows an immediate support ground at $0.0132 and a strong support ground at $0.0122.
Parabolic Sar is showing that the bear has bid its goodbye and has paved path for the bull to return home as the dots have started to aligned below the candlesticks.
Chaikin Money Flow has started to make arrangements for the bull’s return, as it is indicating that the money has started to flow into the market.
Bollinger Bands are forecasting a more volatile market for the cryptocurrency as the bands have started to part from each other making room for more price actions to occur.
1-day
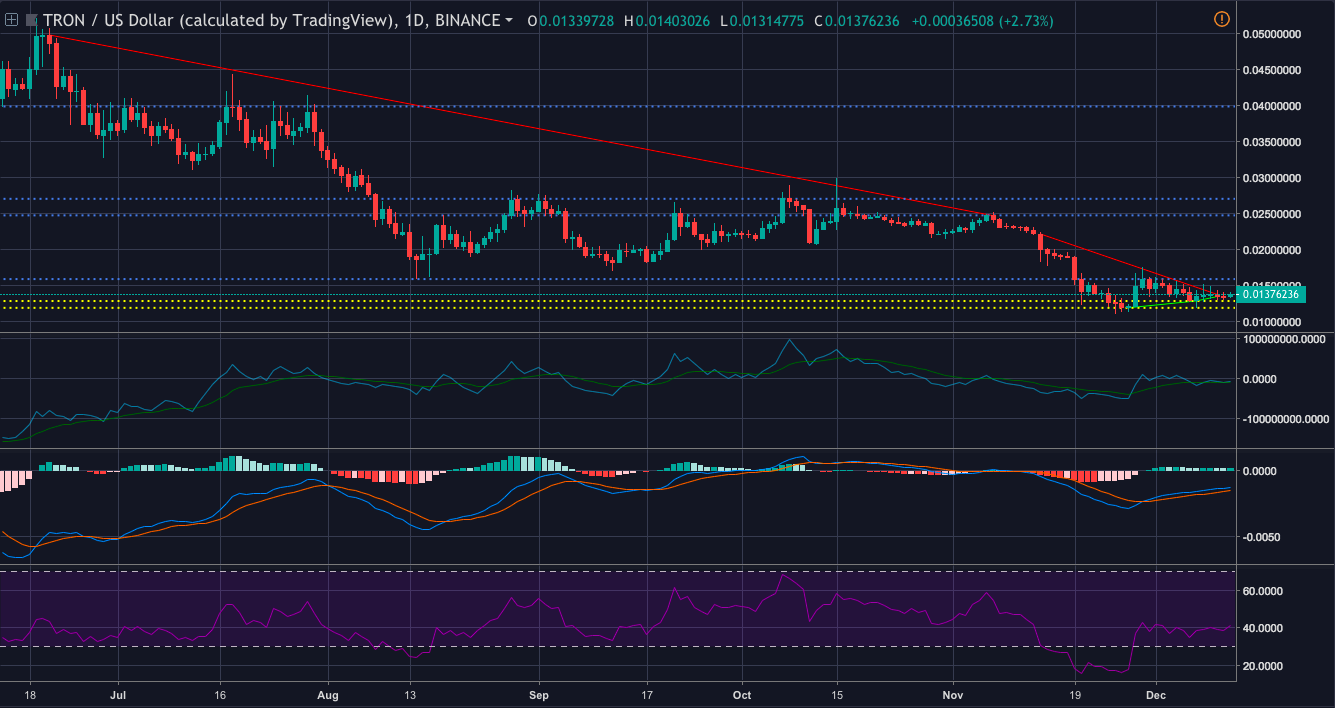
In the one-day chart, the cryptocurrency demonstrates a downtrend from $0.04982 to $0.0247. It shows another fall from $0.0221 to $0.0317. The uptrend for the coin is recorded from $0.0119 to $0.0128. The coin also has another upward movement from $0.0128 to $0.0135.
The immediate resistance for the coin is at $0.0158 and the strong resistance at $0.0398. It shows that the immediate support for the coin is at $0.0128 ground and the strong support is set at $0.0118.
RSI is showing that the buying pressure and the selling pressure for the coin are currently evened out in the market.
Klinger Oscillator is seen rejoicing the bull’s return and the bear’s departure as the reading line has made a crossover to take the upward direction.
MACD is also on the same page as the moving average line has made a bullish crossover.
Conclusion:
All the indicators are in favor of the bull after a very long time. This includes the Parabolic SAR and the CMF from the one-hour chart and the RSI, Klinger Oscillator and MACD from the one-day chart.


Article comments