Monero [XMR/USD] Technical Analysis: Bears likely to take control of the market
![Monero [XMR/USD] Technical Analysis: Bears likely to take control of the market](https://coinhub.news/img/b2/b219cacadbc1a3e0349c9eb78e19dd3f_730_522.webp)
With the cryptocurrency market is witnessing a bear-run at the moment, Monero [XMR] is no different from a lot of the top-tier coins as it has also gone into a slump. At press time, XMR was trading at $110.52, with a market cap of $1.82 billion. The total 24-hour trading volume was $13.2 million with a market cap of $1.82 billion. The total 24-hour trading volume was $13.2 million with a drop of 1.57% in the trading price.
1-hour:
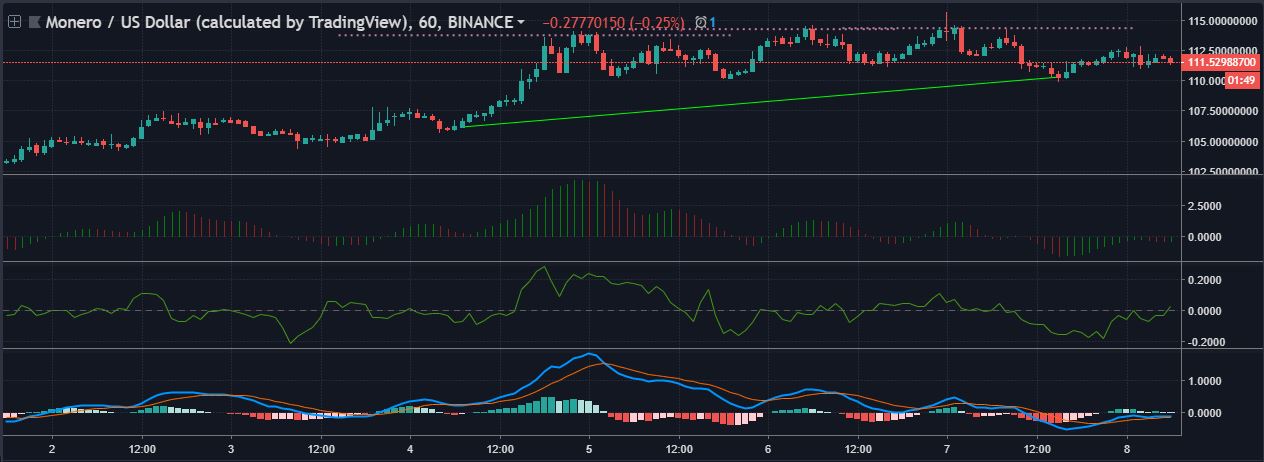
The one-hour graph of the token showcases an uptrend for the cryptocurrency. The uptrend is ranging from $106.19 to $110.31, whereas there are two resistance levels set at $113.78 and $114.25. However, these resistance points were broken by a more immediate resistance fixed at $114.31. A clear ascending triangle can be observed in the given chart.
The Awesome Oscilat0r has turned green after flashing red on a short streak. Therefore, the indicator is predicting a bearish run for Monero.
The Chaikin Money Flow is taking a flight above the 0-mark to side with the bull. The indicator is positive on the upcoming XMR price trend.
The MACD has made a bullish crossover as well but is now joining with the signal to give a neutral outlook on the subject.
1-day:
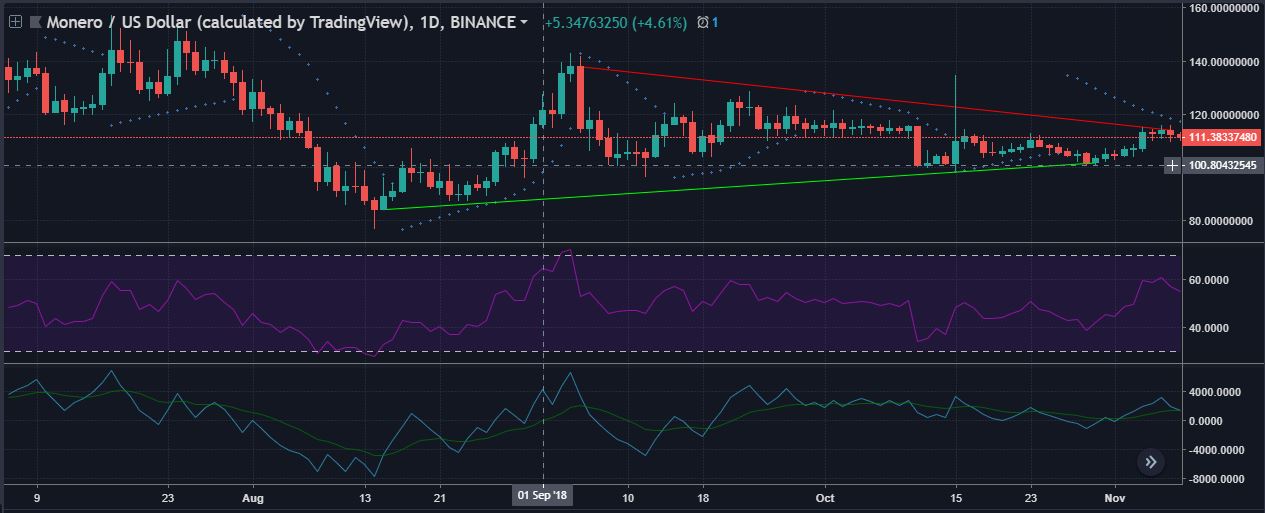
In the one-day time frame, the downtrend is ranging from $137.91 to $114.47 whereas the uptrend is stretching from $84.18 to $101.77. However, a breakout in the trend is not visible as of now.
The Parabolic SAR is bearish on the Monero market. The dots are dancing above the candlesticks, pressurizing the prices into a downward trend.
The RSI spiked to approach the overbought zone, but is now taking a downhill walk. However, the indicator is still in the bullish zone, making its way to the bear’s den.
The Klinger Oscillator has made a bullish crossover by the signal. It was moving up, similar to the RSI. The reading line is now traveling back to side with the bear.
Conclusion
In the technical analysis, it has been observed that almost all the indicators are suspecting a bearish haul for the coin. However, the Awesome Oscillator and Chaikin Money Flow are still rooting for a positive trend in the XMR market.


Article comments