Ethereum’s bulls halted by notorious bears as trend reversal takes place

Ethereum [ETH] had a rough September as the price of the coin fell by over13% on September 24. This fall devalued the price of the coin to $163.19 from $189.79 within an hour. ETH has been making recovery attempts since and has managed to raise its value by 6.46% in October. The current price of the coin stands at $182.50 with a market cap of $19.74 billion and a 24-hour trading volume of $8.16 billion.
1-hour
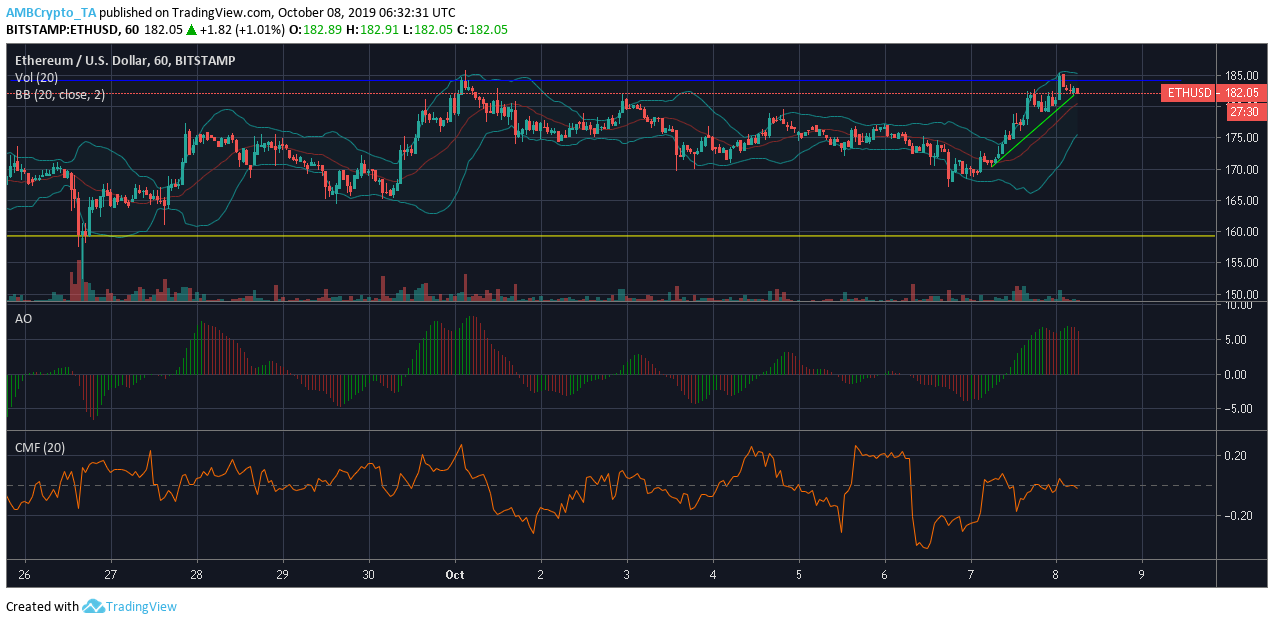
Resistance: 184.18
Support: 159.30
Bollinger Bands indicated high volatility in the ETH market as the bands diverged. The moving average was under the candlesticks, reflecting a bullish market.
Awesome Oscillator suggested a rising bearish momentum.
Chaikin Money Flow dipped under 0, indicating money flowing out of the market, making it bearish.
1-day
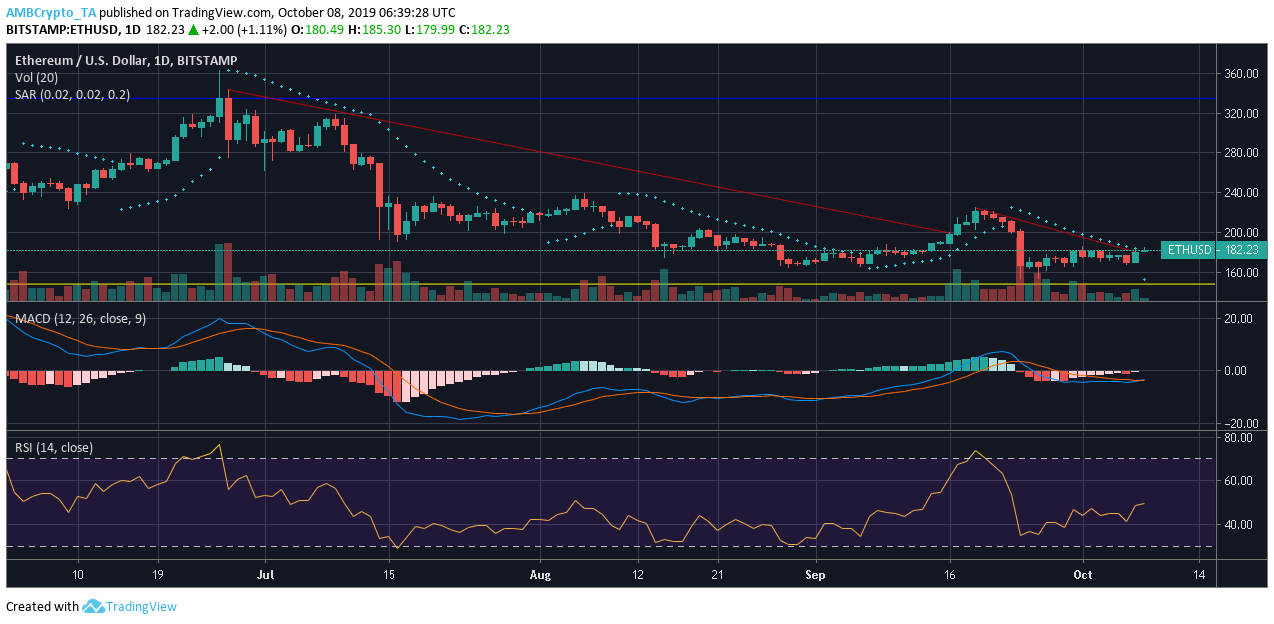
Resistance: 334.78
Support: 148.10
Parabolic SAR pointed at a bearish market as the markers aligned under the candlesticks.
MACD line took over the signal line in a recent crossover, reversing the bearish trend to a bullish one.
Relative Strength Index indicated that the buying and selling pressures have evened.
Conclusion
According to the hourly and daily chart of Ethereum, a bearish trend looks more prevalent as indicated by Awesome Oscillator, Chaikin Money Flow, Parabolic SAR, and MACD.


Article comments