Ethereum remains neutral as it maintains balance between bears and bulls

1-hour chart
In the one-hour price chart, ETH formed support at $169.64 and confronted resistance at $192.71 and $173.56. ETH recorded a sharp downtrend from $193.70 which extended to $172.35.
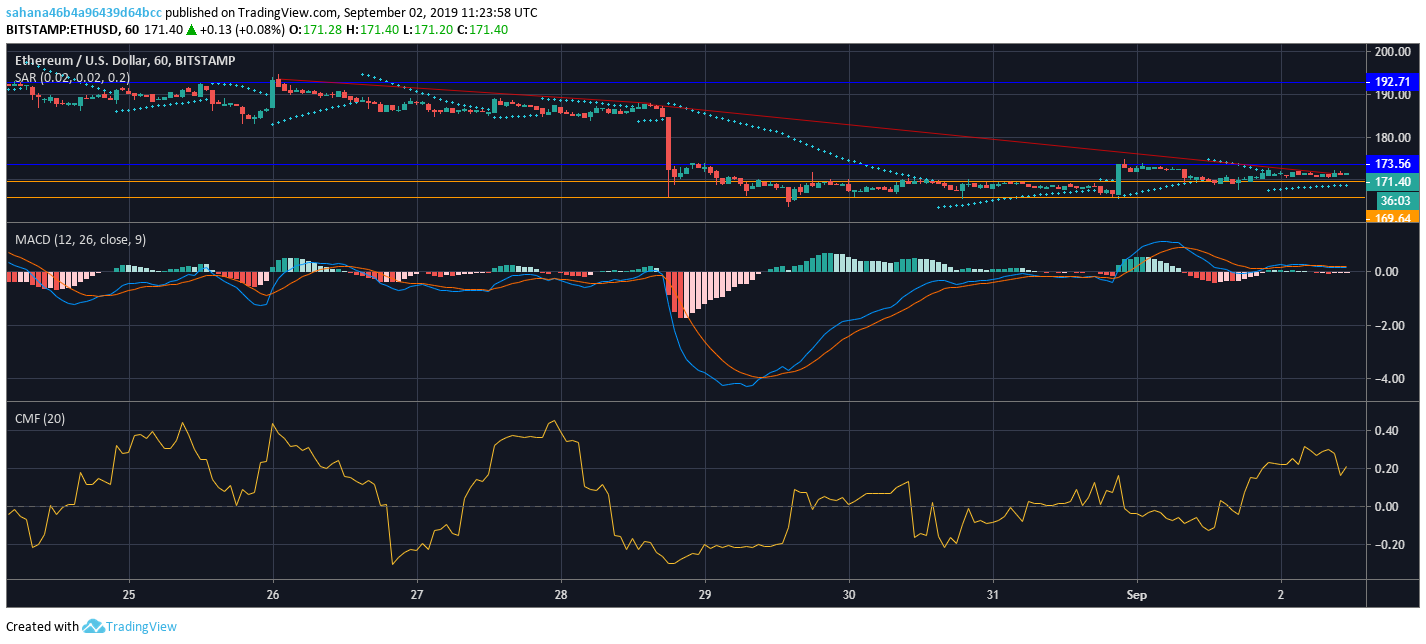
The Parabolic SAR indicator indicated a bullish market as the markers were aligned above the candlesticks.
The MACD indicator revealed a bearish trend as the signal line was below the MACD line.
Chaikin Money Flow pointed at a bullish trend as the marker is seen above the zero line.
1-day chart
In the one day chart, ETH faced resistance at $274.26 and $230.78, while support was seen at $152.17 and $117.06. The coin witnessed an uptrend from $184.13 which extended to $362.58. Furthermore, a downtrend from $318.72 to $194.44 was noted.
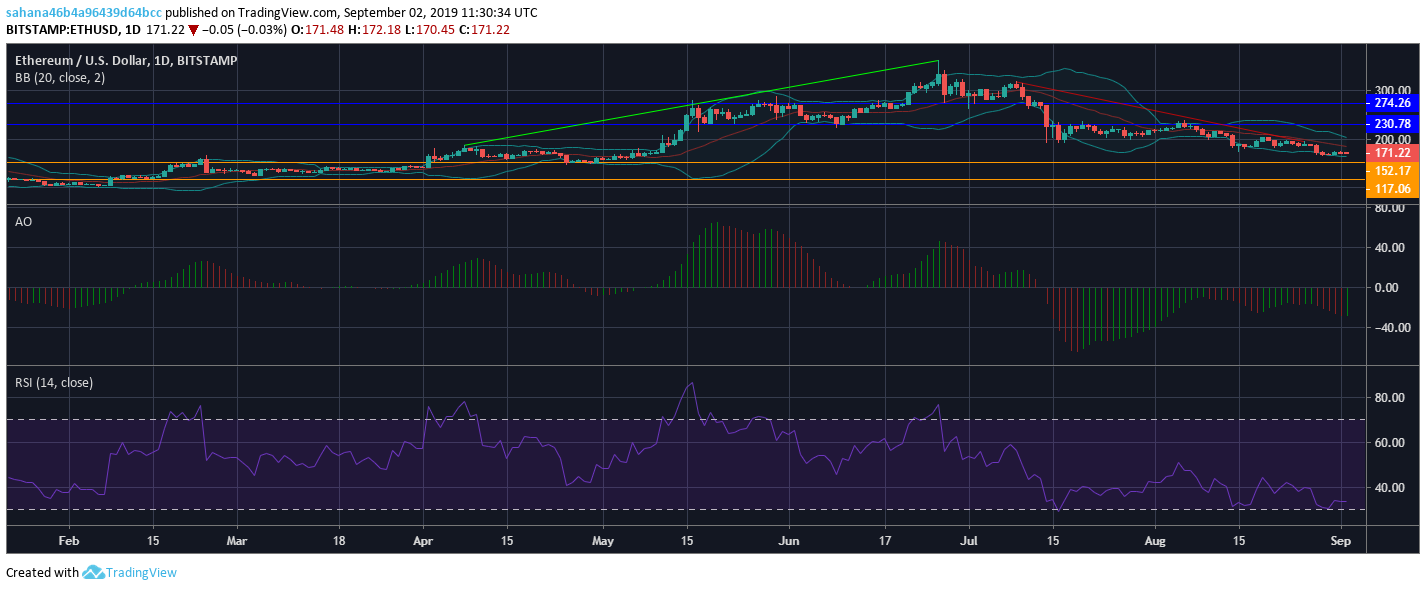
The Bollinger Bands were squeezed, resulting in reduced volatility in the market.
Awesome Oscillator indicated a bearish market for a long time, but green lines were seen appearing further indicating the possibility of a bullish market.
The RSI indicator indicated that ETH is very close to being oversold.
Conclusion
Even though ETH indicated a bullish market in the short term chart, the long term chart indicated a bearish market as the price was progressively decreasing.


Article comments