Bitcoin Cash [BCH/USD] Technical Analysis: Indicator show positive speculations in long-run
![Bitcoin Cash [BCH/USD] Technical Analysis: Indicator show positive speculations in long-run](https://coinhub.news/img/f2/f2777d4f3793517366425b20512008d9_730_522.webp)
Bitcoin Cash [BCH], the fifth largest cryptocurrency recently underwent a huge battle within its community, giving birth to Bitcoin SV, which now sits at the ninth position on the index. During the BCH hard fork, big mining players like Bitmain disrupted the flow of the cryptocurrency market, causing a crash in the space.
At the time of writing, Bitcoin Cash was trading at $141 with a market cap of $2.4 billion. The token is currently down by 8.7% with a 24-hour trading volume of $86.8 million.
1-hour:
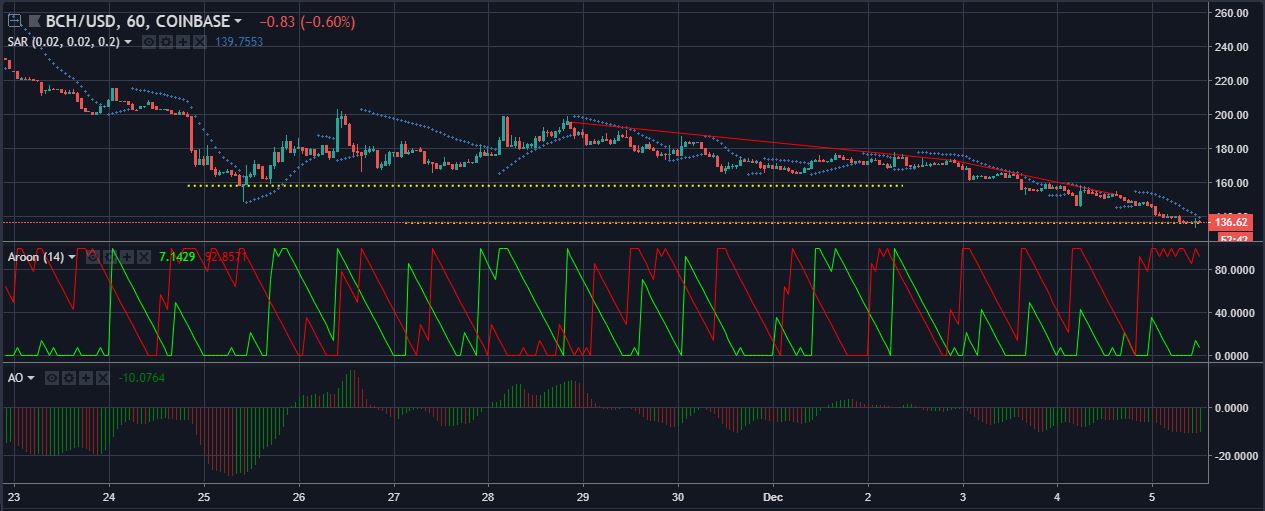
Since the last week of November, two major downtrends have been observed in the BCH market. The first downtrend is extending from $195 to $173 while the other one is seen to be ranging from $173 to $153. Currently, two support levels are set to hold the prices from falling further. The most immediate support is fixed at $136.6.
The Parabolic SAR is strongly bearish on the cryptocurrency. This is observed the position of the dots that are assembled above the price candles.
The Aroon indicator is also showing severe signs of the bear standing in the middle of the BCH market. The downtrend is much stronger than the uptrend in the given chart, confirming the negative speculation.
The Awesome Oscillator is surprisingly glowing green, against the above indicators. The bars that were earlier flashing red are now switching between the two colors.
1-day:
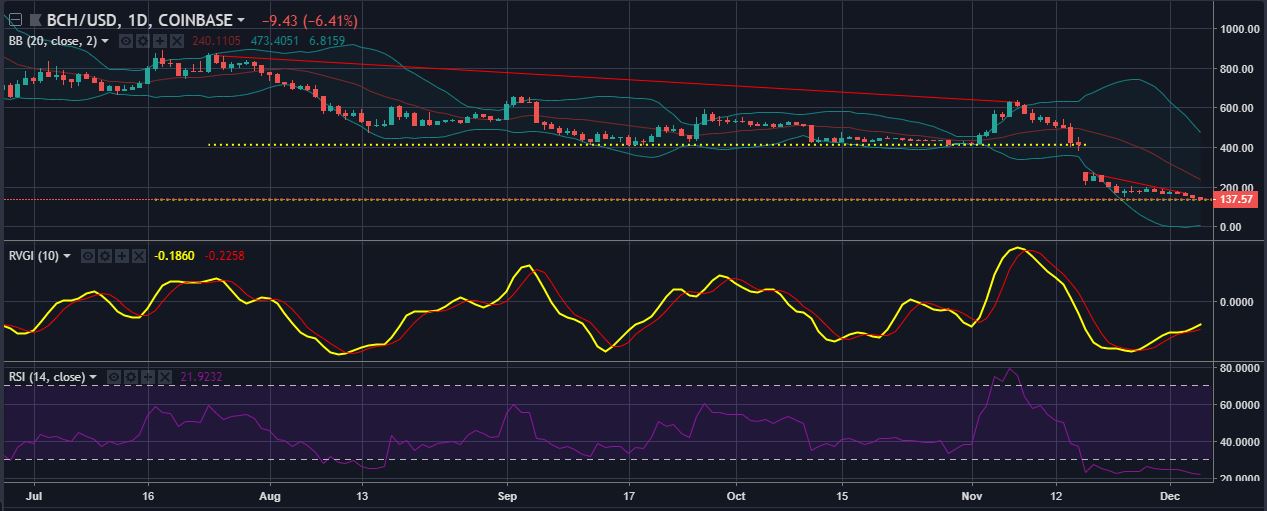
In the 1-day scenario of the BCH candlesticks, the two downtrends are extending from $863 to $627 and $278 to $174, with a gap of almost a week in the middle due to the Bitcoin Cash hard fork.
Furthermore, prior to the fork, the $413 support level was working strongly for the price trend but get knocked off after the infamous break up of the community. Currently, the support is set at a low level of $136.
The Bollinger Bands are signaling high volatility in the BCH market as the indicator has broadened the gap between the bands.
The Relative Vigor Index is currently bullish on the coin as it has made a bullish crossover by the signal line. The RVGI is still moving up to confirm its bullish stance on the matter.
The RSI is extremely bearish on the fate of Bitcoin Cash, currently traveling inside the oversold zone. However, a trend reversal may be observed soon. Therefore, RSI is indicative of a bullish run in the foreseeable future.
Conclusion:
In this technical analysis, it has been observed that the indicators used in the shorter timeline are bearish on the cryptocurrency while the latter indicators are vouching for a trend reversal. Furthermore, the Bollinger Bands are also advocating for high volatility in the market, supporting the possibility of a trend reversal.


Article comments