Bitcoin Cash [BCH] Technical Analysis: Bulls outpace bears in the short-term; long-term still in limbo
![Bitcoin Cash [BCH] Technical Analysis: Bulls outpace bears in the short-term; long-term still in limbo](https://coinhub.news/img/c2/c287041cb3237fe1b62f64f277b2afe5_730_522.webp)
Bitcoin Cash [BCH] seems to have temporarily shielded itself from the constant bear attacks as indicators predict a short-term bullish trend. However, the token is still being dragged down by the bear army in the long-term as the prices have been going down almost consistently over the last few months.
At press time, BCH, the world’s fourth-largest cryptocurrency in terms of market cap, was trading at $439.56, after going up 0.92% over the last 24 hours. BCH worth $293.78 million was traded over the last 24 hours, with a market cap of $7.65 billion, according to CoinMarketCap.
1-hour
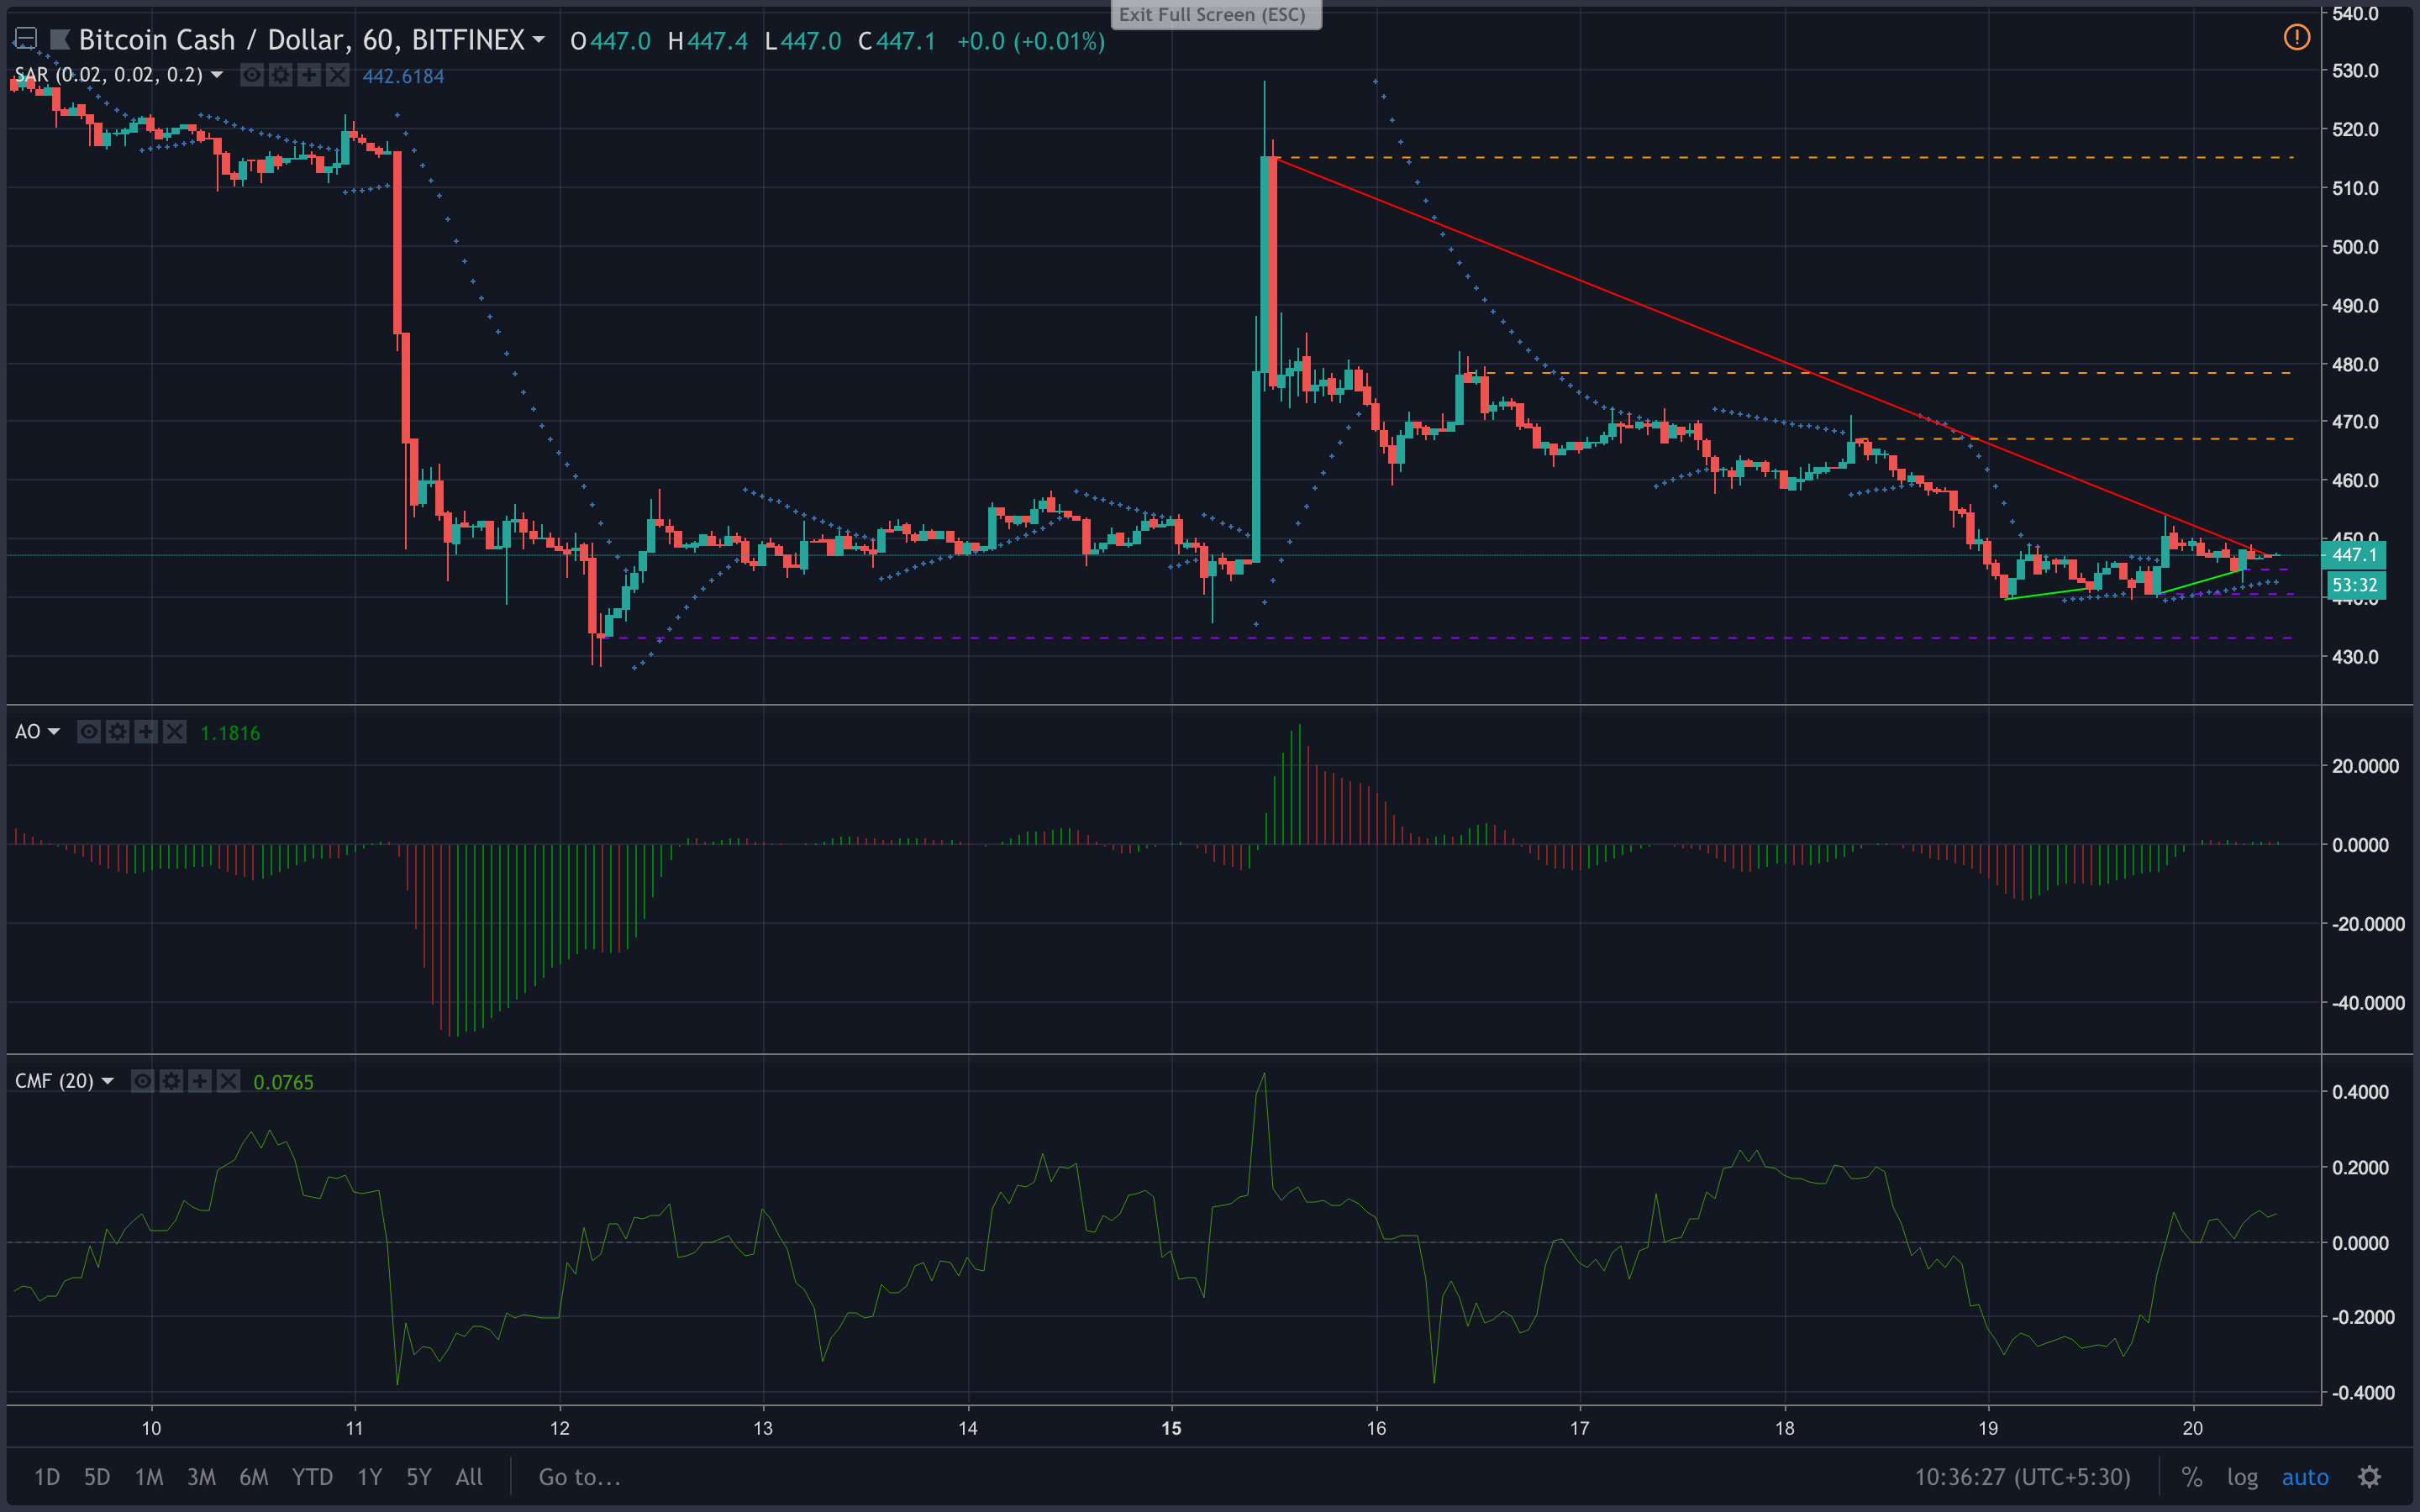
A consistent upward trend was observed from $439.6 to $441.5 on 19th October 2018. The upward trend seems to have continued the next day as another skyward movement of prices was observed between 19th October and 20th October, from $440 to $444.7.
Conversely, on the long-term, the trend seems to be stumbling as a sturdy downward trend was observed from $515.1 to $447.1 between 15th October and 20th October.
The Awesome Oscillator seems to have had a rough field day. After almost constant green bars, the market now seems to have slowed down, with green and red bars constantly wavering. The bars are currently green, pointing at a bullish trend in the short-term.
The Chaikin Money Flow [CMF] chart speaks a similar story. At press time, CMF was at +0.083 while continuing its upward drift. This is a clear indicator that money is flowing into the market, pointing a bullish trend in the short-term.
The Parabolic SAR dots have aligned themselves below the candlesticks since 19th October, pointing at a robust bullish trend in the short-term.
1-day
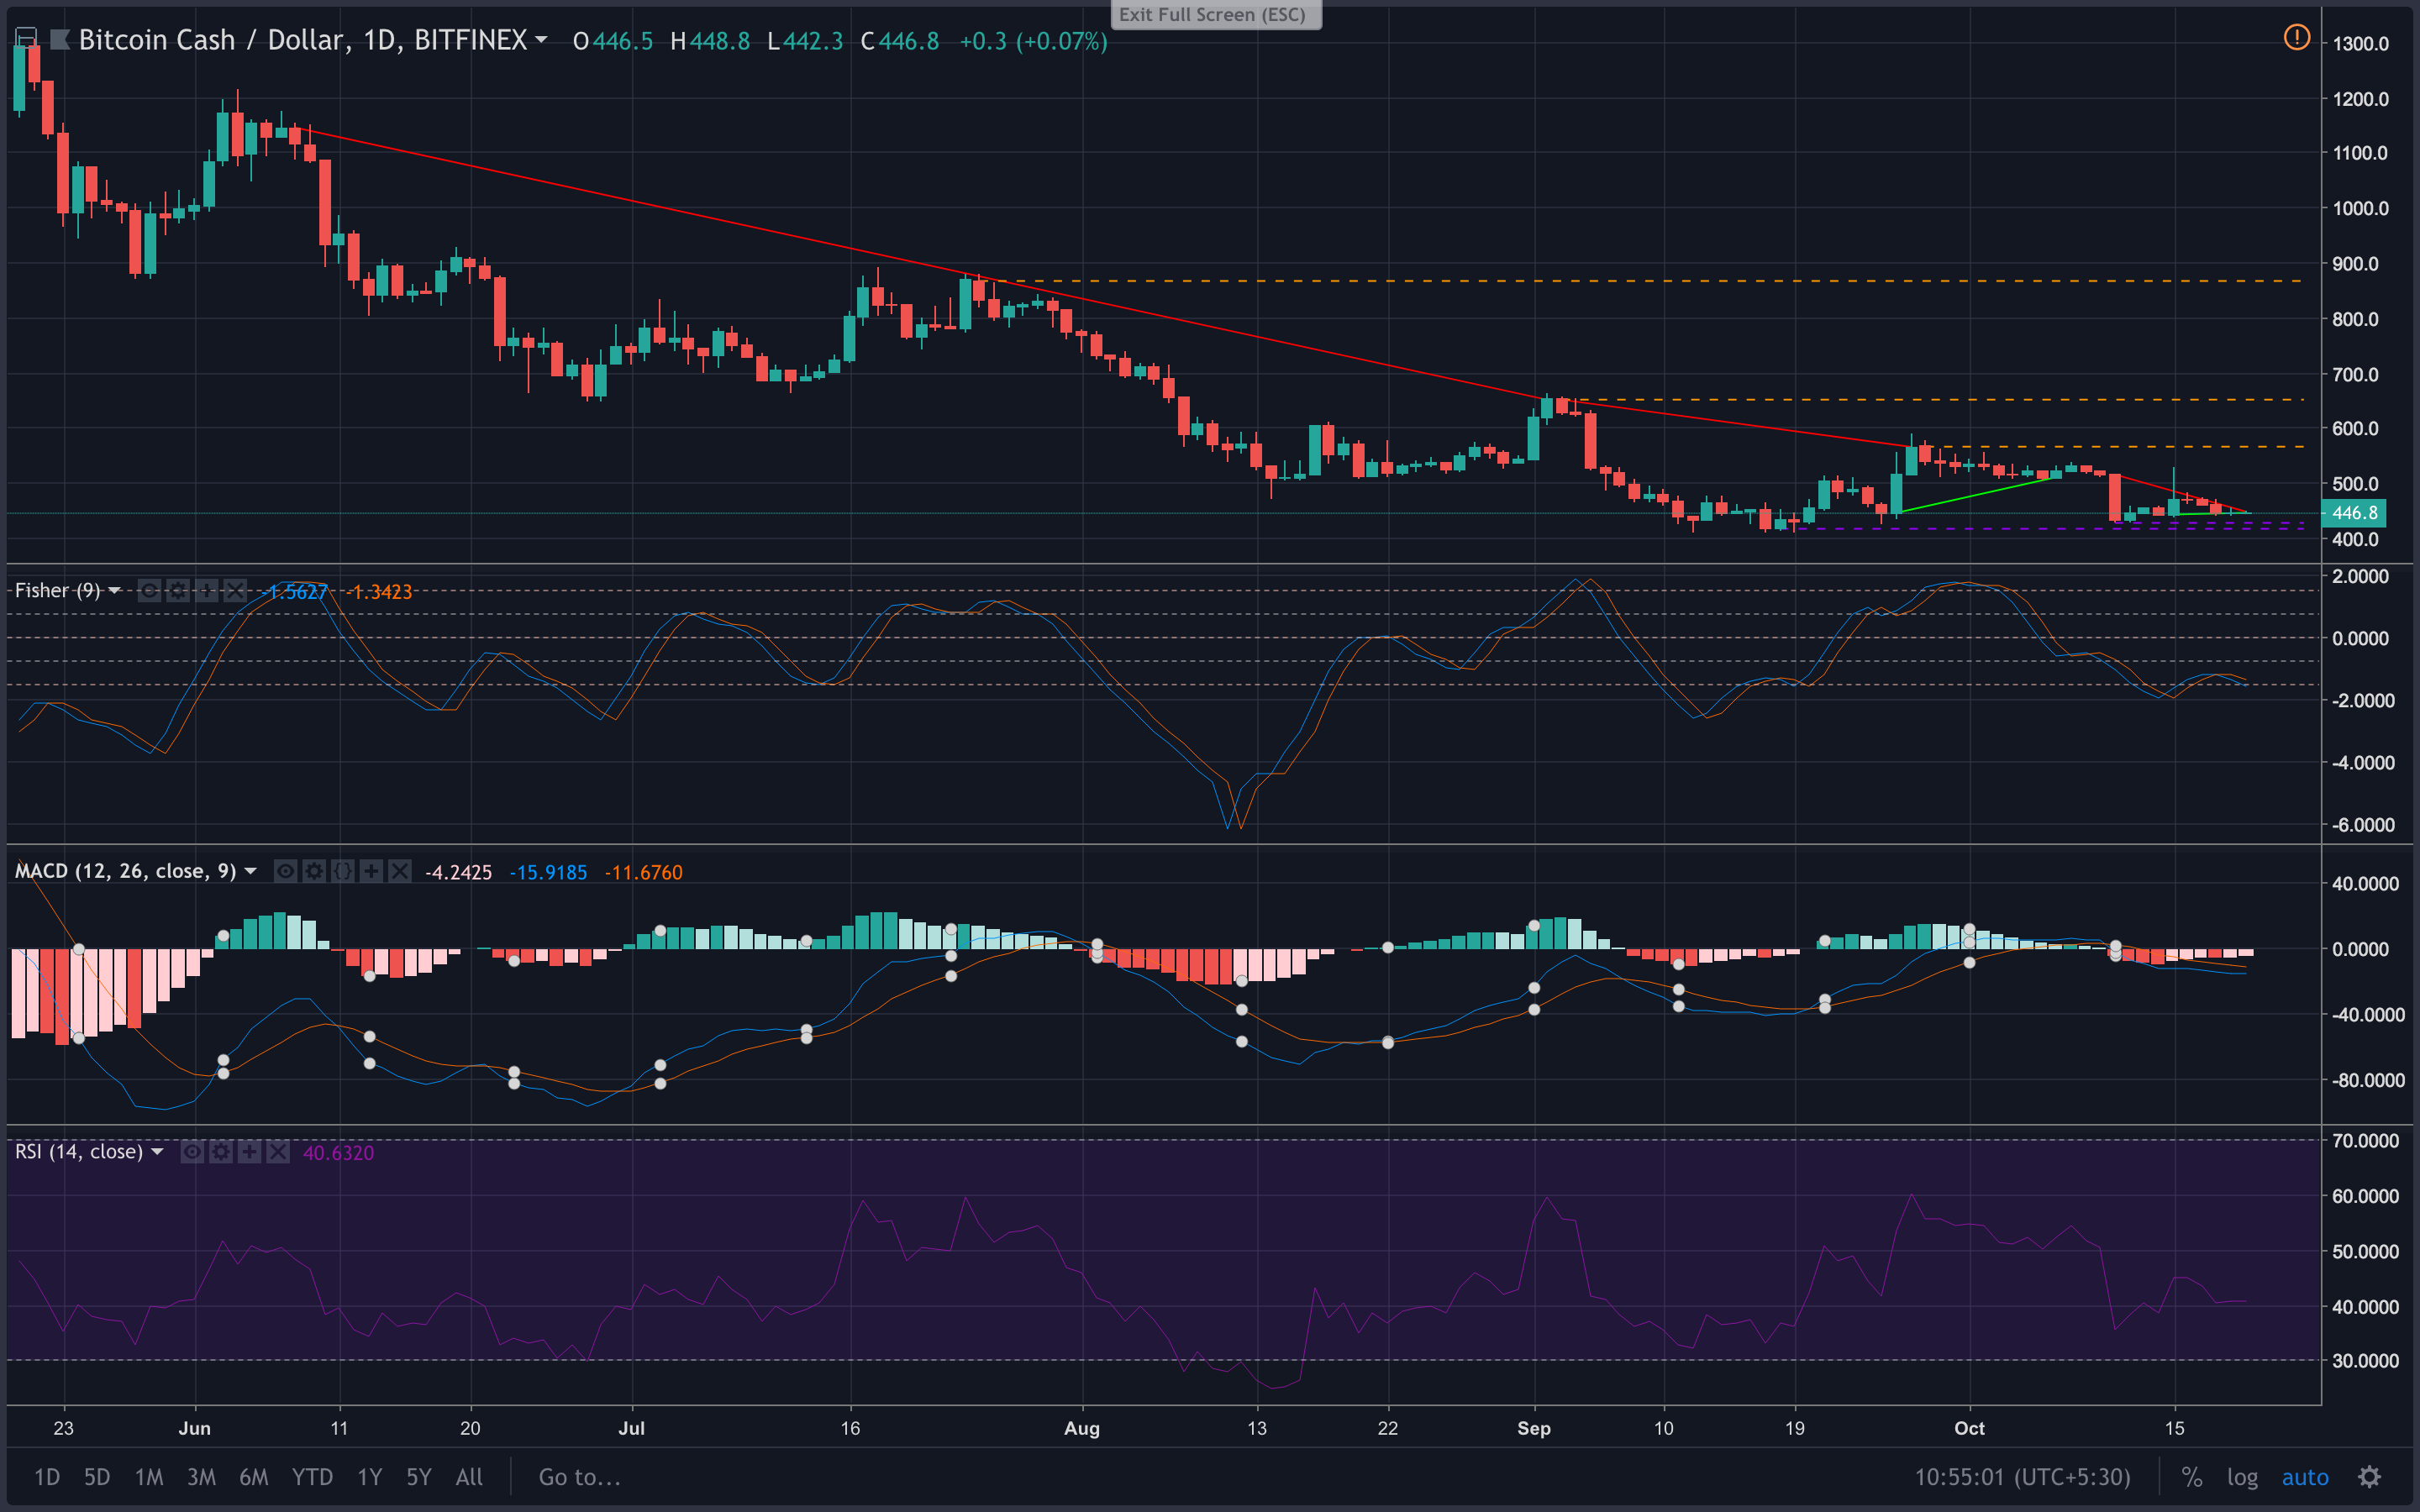
On the one-day chart, a resilient downward trend can be observed from $1,145.0 to $651.7 between 8th June and 2nd September. This trend again repeats itself throughout September, as the prices went from $651.7 to $566.0. This month, the trend line shows a similar pattern as the prices tanked from $516.1 to $448.8 between October 15 and October 20, 2018.
The only substantial upward movement of prices was between 26th September and 7th October, when the prices went up from $446.7 to $511.2. A smaller upward drift was seen between 15th October and 20th October from $443.6 to $446.5.
The MACD chart shows the moving average line on a downward path, crossing the signal line on October 10. This is a clear indicator of a bearish market.
The Fisher Transform chart shows the Fisher line moving down the graph, crossing the trigger line. This indicates a bearish market trend.
The RSI chart shows the token climbing back from a slightly oversold position in the medium-term. The line has now stagnated, indicating almost an equal buying and selling pressure.
Conclusion
According to Awesome Oscillator, Chaikin Money Flow, and Parabolic SAR, a bullish market can be seen developing in the short-term. If the trend continues, the immediate resistance will be at $467.0 in the long-term. If this is broken, the next resistances are at $478.3 and $515.1.
If the prices were to go down on the long-term as predicted by the MACD and Fish Transform charts, the immediate support will be at $428.3. If this support is broken, the next support will be at $417.5.


Article comments